
Leveraging Dynamic Business Models for Enterprise Architecture
In the session Leveraging Dynamic Business Models for Enterprise Architecture, part of the System Dynamics for Business Innovation series led by Kim Warren, the conversation centered on enriching Enterprise Architectures (EAs) through the integration of quantitative Dynamic Business Models (DBMs). This approach significantly amplifies the efficacy and reliability of IT strategies and planning.
Course
Dynamic Business Modelling
How to build powerful living models of plans or issues in half the time of using spreadsheets
Key Insights:
- Foundation of Enterprise Architectures (EAs):
- EAs provide a structural blueprint for IT strategy development, focusing on the organization’s processes and how these support its operational goals.
- The webinar highlighted the importance of understanding these frameworks for implementing effective IT systems aligned with business objectives.
- Role of Dynamic Business Models (DBMs):
- DBMs contribute to a more robust EA by introducing quantitative analyses that validate and enhance the traditionally qualitative aspects of EA.
- By modeling business dynamics quantitatively, DBMs facilitate more accurate IT system alignment with strategic business goals, improving resource allocation and change management.
- Synergies between EAs and DBMs:
- The webinar illustrated how DBMs strengthen EAs by providing a rigorous analytical foundation that accelerates and refines the architecture building process.
- These models help predict the impact of IT strategies on business performance, making implementation more effective.
- Applications and Validation:
- DBMs offer a structured approach to testing and validating IT strategies before full-scale implementation, ensuring that IT plans are both effective and aligned with overarching business strategies.
- The session underscored the utility of DBMs in real-world applications, demonstrating their capacity to support complex decision-making across diverse business domains.
- Impact on IT Strategy and System Planning:
- Incorporating DBMs into EA efforts leads to more informed decision-making, with enhanced insights into the interactions between various business functions and IT systems.
- This integrated approach supports a proactive stance in IT strategy formulation, emphasizing continuous adaptation and alignment with business changes.
The webinar was particularly relevant for IT professionals, systems architects, business analysts, and strategic managers. It also offered critical insights for academics and students in business and technology disciplines.
Watch the recording below
Whoops, this recording is available for members and ticket purchasers only. Please login to verify. If you’re not a member, purchase a membership here. You can also buy a ticket to watch the recording here.
About the Speaker
Kim Warren is an experienced strategy professional, teacher, and publisher of online courses and teaching resources on business modeling – fast becoming a mainstream capability for executives, consultants, and business students. He was awarded the Jay Wright Forrester Award by the International System Dynamics Society in 2005 and was the Society’s President in 2013.
Recent Posts
Call for Presenters: Seminar Series
Call for Presenters: Seminar Series We at the System Dynamics Society are continually seeking vibrant and knowledgeable presenters for our ongoing Seminar Series. As we unfold the calendar, there’s always a place for more insights, experiences, and expertise to enrich...
Honoring Excellence: A Glimpse into the Awards of the International System Dynamics Conference
Honoring Excellence: A Glimpse into the Awards of the International System Dynamics Conference The International System Dynamics Conference brings together experts, practitioners, and students to exchange ideas, showcase real-world applications, and celebrate...
From Bergen to Global: UiB’s System Dynamics Group
From Bergen to Global: UiB’s System Dynamics Group The System Dynamics Group, an autonomous research group at the University of Bergen (UiB) was established in 1971 by professor emeritus Svein Nordbotten. Inspired by the work of Jay W. Forrester, Nordbotten...
Upcoming Events

Virtual Career Fair by MINDS & SDS
The Master students in System Dynamics at the University of Bergen, in partnership with the System Dynamics Society, are excited to host an enriching Virtual Career Fair. This event is designed to connect students, alumni, and professionals in the field of System...
Recent Business cases
A Design Value Calculator: A System Dynamics Boardgame
A Design Value Calculator: A System Dynamics Boardgame EXECUTIVE Summary Product design is a specific form of complex innovation that touches all areas of an organization’s management. While entrepreneurs recognise the value of design, they often tend to focus...
The World Bank Uses System Dynamics to Identify Root Causes of Poverty
The World Bank Uses System Dynamics to Identify Root Causes of Poverty EXECUTIVE Summary Madagascar has one of the highest poverty rates in the world. In 2022, an astonishingly three out of every four people in Madagascar lived below the poverty line. Poverty has...
Fast-Track Cities Uses System Dynamics to Enhance HIV Care
Fast-Track Cities Uses System Dynamics to Enhance HIV Care EXECUTIVE Summary Low levels of viral suppression at 69% for people with HIV make it hard to believe the 95% target level will be achieved by 2030 in St. Louis, USA. As a solution, Fast-Track Cities-STL opted...
Join us

A Design Value Calculator: A System Dynamics Boardgame
EXECUTIVE Summary
-
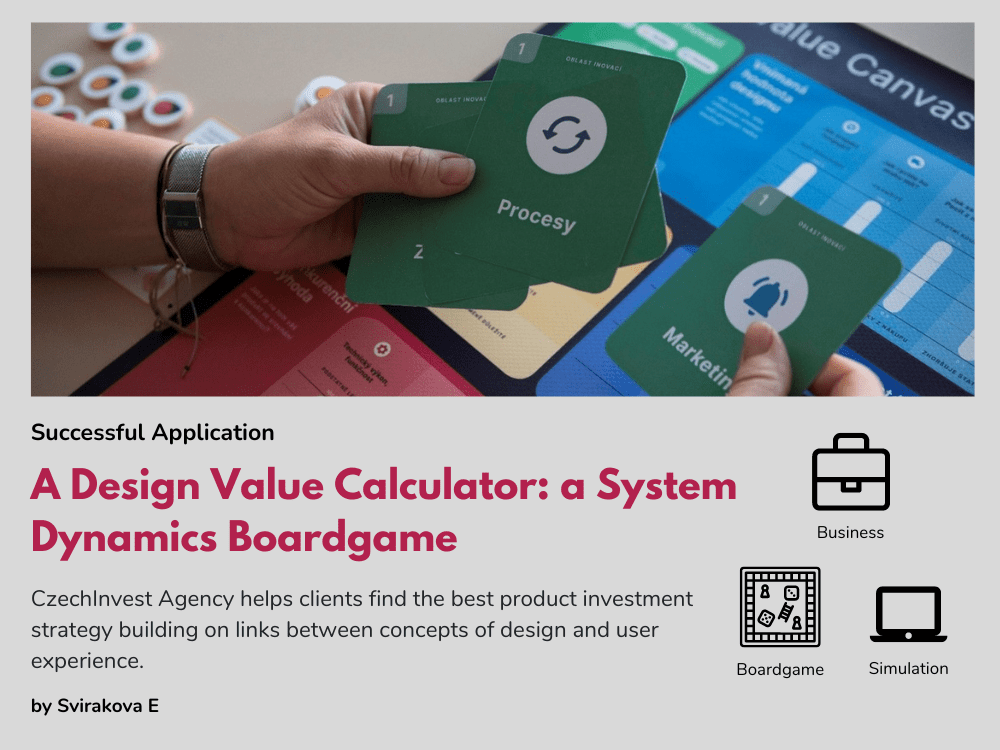
Product design is a specific form of complex innovation that touches all areas of an organization’s management. While entrepreneurs recognise the value of design, they often tend to focus on areas that customers recognise as important but that they are often already happy with. Helping entrepreneurs to systemically assess the benefits of spending on developing different aspects of the user experience is, hence, fundamental to increase the return over investment and to improve business sustainability.
-
To address this, the CzechInvest Agency developed an interactive board game powered by a System Dynamics model simulator that simulates the economic development of a company over six years and calculates the profitability of changes made to the product design.
-
Based on the game results, the Agency presents opportunities to improve product design. The company’s management can thus objectively identify weaknesses and chooses a strategy to design a better product that improves profits.
#CzechInvest #ProductDesign #Innovation #CzechRepublic
The Problem
Entrepreneurs face a multitude of challenges when it comes to product design, ranging from understanding user needs to navigating technical constraints. One of the primary hurdles is identifying and addressing the true pain points of their target audience. Without a deep understanding of user behavior, preferences, and expectations, entrepreneurs risk developing products that fail to resonate with their intended market.
Additionally, entrepreneurs often fail to understand the concept of product design focusing too much on a particular aspect of their product (often the way it looks) neglecting other aspects of it. While the product presentation is important it is only one part of product design and entrepreneurs need to have a holistic view of the product balancing user-centric design with technical feasibility and cost considerations. In short, entrepreneurs need to ensure that their product ideas are not only desirable but also manufacturable and economically feasible.
The Solution
The solution developed consists of a board game and a complementary System Dynamics model. The game covers five areas of innovation that players can decide to invest on, and the simulation model is used to estimate the performance of these investments. The five areas of innovation players can select by placing a card on the boardgame are: i) services (Služby) ii) Marketing methods, iii) Customer Relationships (Vztahy se zákazníky), iv) Goods and products (Zboží), and v) Internal Company Processes (Procesy).
Once the player has selected an area, the performance of the players decision is estimated using a System Dynamics model designed for this purpose. The figure shows an overview of the building blocks of the System Dynamics model and their links. A customer segment is a group of people or organizations that a company wants to attract and create value for through an appropriate value proposition. The larger the customer segment, the more customer relationships to manage and the busier the distribution channels. Every sale means billing, and billing is a source of revenue. Higher revenue means higher PROFIT for the company, thus growing key resources, one of which is the bank account. The more money in the bank account, the better it is to buy assets, hire new employees, increase product production capacity, and expand the distribution network.

The Design Value Algorithm (DVA) coefficient enters the model in the Customer Segment building block (see figure of the Stock and Flow diagram) and thus influences all other elements in the model. The input of the DVA coefficient to the Customer Segment can also be verified in the Business Algorithms in the Dynamic Business Model illustration.

The winner of the game can be determined either:
a) by the evolution of PROFIT’s cumulative profit with other players.
b) by looking at the impact of the design improvements made during the game.
Outcomes
CzechInvest clients implemented this solution and offers structured interviews to company management. The game demonstrates a systemic link between the concepts of design and user experience and quickly reveals the best strategy for further investment in product design.
Below there are some examples and comments from one of the customers that played the game:
Client Number 1X – XYZ Ltd: “The measured value of design is the difference between the evolution of the PROFIT indicator that the company generates without investing in design (the blue curve in the graph) and the evolution of the profit that the company generates based on the decision to invest in design (the other three curves). The value of design is a dynamic indicator that changes over time.”

Interpretation for the client 1X – XYZ Ltd: “The company needs to invest in design; in this situation, where its average UX is 66%, it is profitable. “
According to the parameters given: the average UX (User Experience) = 0.66. This means that the company can still increase user experience by 34%. However, the manager did not make a strategic decision to earn more on design. Instead, he chose a strategy that is not in line with the company’s potential to increase UX. He placed investments in improving the functionality of the product first and investments in distribution third. In doing so, he identified the lowest UX sub-value in sales. If he wants to serve his customers better, he needs to strategically address sales first.
Do you want to know more?
Visit the Design Value Calculator or connect with Eva Svirakova.
OTHER SUCCESSFUL APPLICATIONS
A Design Value Calculator: A System Dynamics Boardgame
A Design Value Calculator: A System Dynamics Boardgame EXECUTIVE Summary Product design is a specific form of complex innovation that touches all areas of an organization’s management. While entrepreneurs recognise the value of design, they often tend to focus...
The World Bank Uses System Dynamics to Identify Root Causes of Poverty
The World Bank Uses System Dynamics to Identify Root Causes of Poverty EXECUTIVE Summary Madagascar has one of the highest poverty rates in the world. In 2022, an astonishingly three out of every four people in Madagascar lived below the poverty line. Poverty has...
Fast-Track Cities Uses System Dynamics to Enhance HIV Care
Fast-Track Cities Uses System Dynamics to Enhance HIV Care EXECUTIVE Summary Low levels of viral suppression at 69% for people with HIV make it hard to believe the 95% target level will be achieved by 2030 in St. Louis, USA. As a solution, Fast-Track Cities-STL opted...
Upcoming Events
Virtual Career Fair by MINDS & SDS
The Master students in System Dynamics at the University of Bergen, in partnership with the System Dynamics Society, are excited to host an enriching Virtual Career Fair. This event is designed to connect students, alumni, and professionals in the field of System...
Recent Posts
Society Governance Updates
Society Governance Updates Welcome, Allyson! New President Allyson Beall King joined the Policy Council as our 2024 President. Her primary role is as director of the Washington State University School of the Environment, which focuses on regional ecologies and our...
Call for Presenters: Seminar Series
Call for Presenters: Seminar Series We at the System Dynamics Society are continually seeking vibrant and knowledgeable presenters for our ongoing Seminar Series. As we unfold the calendar, there’s always a place for more insights, experiences, and expertise to enrich...
Honoring Excellence: A Glimpse into the Awards of the International System Dynamics Conference
Honoring Excellence: A Glimpse into the Awards of the International System Dynamics Conference The International System Dynamics Conference brings together experts, practitioners, and students to exchange ideas, showcase real-world applications, and celebrate...
Join us
OTHER SUCCESSFUL APPLICATIONS
A Design Value Calculator: A System Dynamics Boardgame
A Design Value Calculator: A System Dynamics Boardgame EXECUTIVE Summary Product design is a specific form of complex innovation that touches all areas of an organization’s management. While entrepreneurs recognise the value of design, they often tend to focus...
The World Bank Uses System Dynamics to Identify Root Causes of Poverty
The World Bank Uses System Dynamics to Identify Root Causes of Poverty EXECUTIVE Summary Madagascar has one of the highest poverty rates in the world. In 2022, an astonishingly three out of every four people in Madagascar lived below the poverty line. Poverty has...
Fast-Track Cities Uses System Dynamics to Enhance HIV Care
Fast-Track Cities Uses System Dynamics to Enhance HIV Care EXECUTIVE Summary Low levels of viral suppression at 69% for people with HIV make it hard to believe the 95% target level will be achieved by 2030 in St. Louis, USA. As a solution, Fast-Track Cities-STL opted...
Recent Posts
Society Governance Updates
Society Governance Updates Welcome, Allyson! New President Allyson Beall King joined the Policy Council as our 2024 President. Her primary role is as director of the Washington State University School of the Environment, which focuses on regional ecologies and our...
Call for Presenters: Seminar Series
Call for Presenters: Seminar Series We at the System Dynamics Society are continually seeking vibrant and knowledgeable presenters for our ongoing Seminar Series. As we unfold the calendar, there’s always a place for more insights, experiences, and expertise to enrich...
Honoring Excellence: A Glimpse into the Awards of the International System Dynamics Conference
Honoring Excellence: A Glimpse into the Awards of the International System Dynamics Conference The International System Dynamics Conference brings together experts, practitioners, and students to exchange ideas, showcase real-world applications, and celebrate...
Upcoming Events
Virtual Career Fair by MINDS & SDS
The Master students in System Dynamics at the University of Bergen, in partnership with the System Dynamics Society, are excited to host an enriching Virtual Career Fair. This event is designed to connect students, alumni, and professionals in the field of System...
Dynamic Business Models for Dealing with Competition
In the latest webinar of the System Dynamics for Business Innovation special series, Kim Warren delved into Dynamic Business Models for Dealing with Competition. This session, rich in practical advice and strategic insights, is pivotal for professionals seeking to sharpen their competitive edge. Here’s a breakdown of the webinar’s key points.
Key Takeaways from the Webinar:
- Understanding Competitive Dynamics: The session focused on the use of dynamic business models to navigate competitive business environments. Warren highlighted the importance of understanding how competition plays out in real-time and the impacts on prices, marketing spending, and profits.
- Case Studies and Applications: Warren used two illustrative case studies to demonstrate the practical application of these models. He discussed GSK’s travel vaccines business and its response to a new competitor, and Beyond Meat’s strategy in creating a market for non-meat products. Both cases highlighted the strategic challenges and responses in dynamic competitive environments.
- Types of Competition: Warren outlined three standard competition mechanisms, covering most competitive scenarios. These include racing to capture new potential customers, maintaining existing customers while attracting competitors’ customers, and handling situations where customers can switch between suppliers.
- Practical Strategy Development: The session also touched upon practical aspects of strategic planning, like leveraging dynamic models for both long-term strategy and short-term operational decision-making.
Invitation for Further Learning
This webinar is a must-watch for those interested in refining their competitive strategies and understanding the application of dynamic business models. Viewing the recording will provide a deeper insight into the discussed concepts.
Furthermore, the series will continue to offer rich content on strategic business areas such as IT systems architecture and environmental impact reporting. These upcoming sessions represent a unique opportunity to gain advanced knowledge and skills in the field.
Join us for the upcoming webinars to deepen your understanding of dynamic business models and their critical role in shaping successful competitive strategies
Certificate
Attendees who participate in at least 6 out of the 9 webinars in the series will be eligible to receive a certificate titled “Introduction to Dynamic Business Models.” This is an opportunity to gain recognition of your learning in this innovative field. For those who cannot attend live sessions, recordings will be available, allowing you to review the material and complete the series at your convenience.
Watch the recording to get your certificate code.
Watch the recording below
Whoops, this recording is available for members and ticket purchasers only. Please login to verify. If you’re not a member, purchase a membership here. You can also buy a ticket to watch the recording here.
About the Speaker
Kim Warren is an experienced strategy professional, teacher, and publisher of online courses and teaching resources on business modeling – fast becoming a mainstream capability for executives, consultants, and business students. He was awarded the Jay Wright Forrester Award by the International System Dynamics Society in 2005 and was the Society’s President in 2013.
Recent Posts
Call for Presenters: Seminar Series
Call for Presenters: Seminar Series We at the System Dynamics Society are continually seeking vibrant and knowledgeable presenters for our ongoing Seminar Series. As we unfold the calendar, there’s always a place for more insights, experiences, and expertise to enrich...
Honoring Excellence: A Glimpse into the Awards of the International System Dynamics Conference
Honoring Excellence: A Glimpse into the Awards of the International System Dynamics Conference The International System Dynamics Conference brings together experts, practitioners, and students to exchange ideas, showcase real-world applications, and celebrate...
From Bergen to Global: UiB’s System Dynamics Group
From Bergen to Global: UiB’s System Dynamics Group The System Dynamics Group, an autonomous research group at the University of Bergen (UiB) was established in 1971 by professor emeritus Svein Nordbotten. Inspired by the work of Jay W. Forrester, Nordbotten...
Upcoming Events
Virtual Career Fair by MINDS & SDS
The Master students in System Dynamics at the University of Bergen, in partnership with the System Dynamics Society, are excited to host an enriching Virtual Career Fair. This event is designed to connect students, alumni, and professionals in the field of System...
Recent Business cases
A Design Value Calculator: A System Dynamics Boardgame
A Design Value Calculator: A System Dynamics Boardgame EXECUTIVE Summary Product design is a specific form of complex innovation that touches all areas of an organization’s management. While entrepreneurs recognise the value of design, they often tend to focus...
The World Bank Uses System Dynamics to Identify Root Causes of Poverty
The World Bank Uses System Dynamics to Identify Root Causes of Poverty EXECUTIVE Summary Madagascar has one of the highest poverty rates in the world. In 2022, an astonishingly three out of every four people in Madagascar lived below the poverty line. Poverty has...
Fast-Track Cities Uses System Dynamics to Enhance HIV Care
Fast-Track Cities Uses System Dynamics to Enhance HIV Care EXECUTIVE Summary Low levels of viral suppression at 69% for people with HIV make it hard to believe the 95% target level will be achieved by 2030 in St. Louis, USA. As a solution, Fast-Track Cities-STL opted...
Join us
Dynamic Business Models for Strategic Management Accounting
In the first session of the System Dynamics for Business Innovation special series, led by business strategist and academic Kim Warren, attendees gained valuable insights into the use of dynamic business models in strategic management accounting. This blog provides an overview of the key topics covered in the webinar ti
Key Points from the Webinar:
-
Role of Strategic Management Accounting (SMA): SMA is essential for helping accountants and leaders in developing and monitoring their business strategies. It requires detailed analysis of business data, forecasting, and preparing forward-looking reports.
-
Responding to Market Changes: Strategic Management involves reacting to unexpected competitive threats and market shifts. This includes strategies such as acquiring companies or entering new markets.
-
Use of Financial and Non-Financial Data: Strategic management requires ongoing analysis and interpretation of both financial and non-financial data. This encompasses aspects like capacity factors and their connections within the business.
-
Tools for SMA: SMA uses a combination of financial and non-financial tools. The Balanced Scorecard, for example, connects financial outcomes with operational activities and customer focus.
-
Customer Focus in Business Success: Understanding customer needs is important for business success. Tools like the value curve and the business model canvas help align business offerings with customer needs and set apart from competitors.
-
Budgeting Techniques: The webinar discussed traditional and zero-based budgeting, underlining the need for budgeting approaches that suit current business requirements.
-
Tools for Predictive Analysis: It’s important to have tools that can forecast business outcomes in various scenarios. These tools should consider factors such as revenue, competitor behavior, and strategic objectives.
-
Case Study Application: The webinar demonstrated these concepts through a case study of a new table service restaurant, focusing on sales and profit growth projections.
Invitation for Further Learning:
For those interested in deepening their understanding of Strategic Management Accounting, we recommend watching the recording of this webinar. Further, participation in the upcoming sessions of this series will offer expanded knowledge on topics like competitive strategy, IT systems, and the impact of business decisions on society and the environment.
Join us to further explore the field of Strategic Management Accounting and apply these principles to enhance your business strategies.
Certificate
Attendees who participate in at least 6 out of the 9 webinars in the series will be eligible to receive a certificate titled “Introduction to Dynamic Business Models.” This is an opportunity to gain recognition of your learning in this innovative field. For those who cannot attend live sessions, recordings will be available, allowing you to review the material and complete the series at your convenience.
Watch the recording to get your certificate code.
Watch the recording below
Whoops, this recording is available for members and ticket purchasers only. Please login to verify. If you’re not a member, purchase a membership here. You can also buy a ticket to watch the recording here.
About the Speaker
Kim Warren is an experienced strategy professional, teacher, and publisher of online courses and teaching resources on business modeling – fast becoming a mainstream capability for executives, consultants, and business students. He was awarded the Jay Wright Forrester Award by the International System Dynamics Society in 2005 and was the Society’s President in 2013.
Resoures:
Recent Posts
Call for Presenters: Seminar Series
Call for Presenters: Seminar Series We at the System Dynamics Society are continually seeking vibrant and knowledgeable presenters for our ongoing Seminar Series. As we unfold the calendar, there’s always a place for more insights, experiences, and expertise to enrich...
Honoring Excellence: A Glimpse into the Awards of the International System Dynamics Conference
Honoring Excellence: A Glimpse into the Awards of the International System Dynamics Conference The International System Dynamics Conference brings together experts, practitioners, and students to exchange ideas, showcase real-world applications, and celebrate...
From Bergen to Global: UiB’s System Dynamics Group
From Bergen to Global: UiB’s System Dynamics Group The System Dynamics Group, an autonomous research group at the University of Bergen (UiB) was established in 1971 by professor emeritus Svein Nordbotten. Inspired by the work of Jay W. Forrester, Nordbotten...
Upcoming Events
Virtual Career Fair by MINDS & SDS
The Master students in System Dynamics at the University of Bergen, in partnership with the System Dynamics Society, are excited to host an enriching Virtual Career Fair. This event is designed to connect students, alumni, and professionals in the field of System...
Recent Business cases
A Design Value Calculator: A System Dynamics Boardgame
A Design Value Calculator: A System Dynamics Boardgame EXECUTIVE Summary Product design is a specific form of complex innovation that touches all areas of an organization’s management. While entrepreneurs recognise the value of design, they often tend to focus...
The World Bank Uses System Dynamics to Identify Root Causes of Poverty
The World Bank Uses System Dynamics to Identify Root Causes of Poverty EXECUTIVE Summary Madagascar has one of the highest poverty rates in the world. In 2022, an astonishingly three out of every four people in Madagascar lived below the poverty line. Poverty has...
Fast-Track Cities Uses System Dynamics to Enhance HIV Care
Fast-Track Cities Uses System Dynamics to Enhance HIV Care EXECUTIVE Summary Low levels of viral suppression at 69% for people with HIV make it hard to believe the 95% target level will be achieved by 2030 in St. Louis, USA. As a solution, Fast-Track Cities-STL opted...
Join us

System Dynamics Unravels ICU Tensions at the Portuguese Oncology Institute
EXECUTIVE Summary
-
The Portuguese Oncology Institute (IPO) faced a critical challenge in its intensive care unit (ICU) where doctors and nurses experienced high turnover due to tensions with surgeons and limited resources, ultimately leading to a high death rate. Surgeons accused ICU staff of holding patients longer than necessary, leading to a backlog in surgeries. Despite utilizing external ICUs, the issue persisted.
-
Multicriteria and optimization approaches did not provide a solution. Only a System Dynamics approach using a management flight simulator enabled IPO’s leadership to understand the dynamics and discuss the causes and leverage points around the problem.
-
Based on the System Dynamics model, the IPO established 10 new beds in the appropriate care units leading to the resolution of tensions and decreased turnover and death rates in the ICU.
#IPO #PatientCare #Oncology #Health #Portugal
The Problem
Despite the demanding nature of the work in IPO’s intensive care unit (ICU), doctors and nurses were passionate about their roles. However, the turnover rate was high due to strained relationships with their colleagues. Surgeons, who would only schedule delicate surgeries when the ICU had availability, accused the ICU staff of unnecessarily prolonging patient stays and not vacating beds promptly. As a result, the ICU became a bottleneck, leading to a growing waiting list for surgeries. To address the issue, management began utilizing external ICUs, but this did not alleviate the resentment or reduce turnover. Figure 1 displays the growth of the quitting rate of the IPO’s ICU waiting list, which is the rate at which patients leave the waiting list without being admitted to the ICU for surgery.
Figure 1 – Cumulative distribution of waiting list quitting rate

The ICU faced a high death rate, and care sharply declined when patients left for general wards, as readmission was rare due to bed shortages. To prevent readmission or premature deaths, the ICU kept patients until they were stable for general wards. Surgeons hesitated to operate on fragile cancer patients without available ICU beds. Despite being undersized, the ICU’s high cost per bed (equipment and staff) deterred expansion. IPO’s management hesitated to invest in ICU or intermediate care, as adjacent wards needed more beds for patients awaiting surgery. This compromised the organization’s performance.
The Solution
By employing the System Dynamics approach, stakeholders in the IPO’s ICU, including doctors, nurses, surgeons, and management, were able to gain valuable insights into the intricate interactions and dilemmas that existed. The approach provided a platform to examine the underlying causes of the tensions, identify the systemic drivers contributing to high turnover, and uncover the unintended consequences of certain actions. Figure 2 shows the causal loop diagram (CLD) that was developed along with the medical team and used to discuss the uses of a management flight simulator.
Figure 2 – CLD used for discussion with medical team

Through the use of the management flight simulator, stakeholders were able to witness the unfolding dynamics of the problem. This new understanding enabled IPO’s leadership to make informed decisions and take proactive steps to address the challenges. Figure 3 shows the core components of the System Dynamics model underlying the management flight simulator.
Figure 3 – Simulator core, showing the waiting list at the bottom

Outcomes
The application of the model had a significant impact on IPO’s management. As a result, a new Intensive and Intermediate Care Unit was established, reducing reliance on external ICUs and improving resource management. The ICU’s limited capacity and absence of intermediate care beds had previously led to high death rates and compromised patient care during the transition to general wards. Additionally, the practice of retaining patients in the ICU until they were fit for general wards caused delays in surgeries and increased costs.
With the opening of the new unit, equipped with 6 intensive care beds, 4 intermediate care beds, and 2 isolation rooms, these issues were effectively addressed. IPO’’s dependence on external ICUs was significantly reduced, leading to improved resource allocation within the organization. The expanded capacity and inclusion of intermediate care beds ensured smoother patient transitions and better continuity of care. Timely scheduling of surgeries enhanced efficiency and reduced costs while curbing death rates. The establishment of the Intensive and Intermediate Care Unit demonstrated IPO’s commitment to improving patient outcomes, resulting in a positive impact on both patient care and organizational performance.
OTHER SUCCESSFUL APPLICATIONS
A Design Value Calculator: A System Dynamics Boardgame
A Design Value Calculator: A System Dynamics Boardgame EXECUTIVE Summary Product design is a specific form of complex innovation that touches all areas of an organization’s management. While entrepreneurs recognise the value of design, they often tend to focus...
The World Bank Uses System Dynamics to Identify Root Causes of Poverty
The World Bank Uses System Dynamics to Identify Root Causes of Poverty EXECUTIVE Summary Madagascar has one of the highest poverty rates in the world. In 2022, an astonishingly three out of every four people in Madagascar lived below the poverty line. Poverty has...
Fast-Track Cities Uses System Dynamics to Enhance HIV Care
Fast-Track Cities Uses System Dynamics to Enhance HIV Care EXECUTIVE Summary Low levels of viral suppression at 69% for people with HIV make it hard to believe the 95% target level will be achieved by 2030 in St. Louis, USA. As a solution, Fast-Track Cities-STL opted...
Upcoming Events
Virtual Career Fair by MINDS & SDS
The Master students in System Dynamics at the University of Bergen, in partnership with the System Dynamics Society, are excited to host an enriching Virtual Career Fair. This event is designed to connect students, alumni, and professionals in the field of System...
Recent Posts
Society Governance Updates
Society Governance Updates Welcome, Allyson! New President Allyson Beall King joined the Policy Council as our 2024 President. Her primary role is as director of the Washington State University School of the Environment, which focuses on regional ecologies and our...
Call for Presenters: Seminar Series
Call for Presenters: Seminar Series We at the System Dynamics Society are continually seeking vibrant and knowledgeable presenters for our ongoing Seminar Series. As we unfold the calendar, there’s always a place for more insights, experiences, and expertise to enrich...
Honoring Excellence: A Glimpse into the Awards of the International System Dynamics Conference
Honoring Excellence: A Glimpse into the Awards of the International System Dynamics Conference The International System Dynamics Conference brings together experts, practitioners, and students to exchange ideas, showcase real-world applications, and celebrate...
Join us
OTHER SUCCESSFUL APPLICATIONS
A Design Value Calculator: A System Dynamics Boardgame
A Design Value Calculator: A System Dynamics Boardgame EXECUTIVE Summary Product design is a specific form of complex innovation that touches all areas of an organization’s management. While entrepreneurs recognise the value of design, they often tend to focus...
The World Bank Uses System Dynamics to Identify Root Causes of Poverty
The World Bank Uses System Dynamics to Identify Root Causes of Poverty EXECUTIVE Summary Madagascar has one of the highest poverty rates in the world. In 2022, an astonishingly three out of every four people in Madagascar lived below the poverty line. Poverty has...
Fast-Track Cities Uses System Dynamics to Enhance HIV Care
Fast-Track Cities Uses System Dynamics to Enhance HIV Care EXECUTIVE Summary Low levels of viral suppression at 69% for people with HIV make it hard to believe the 95% target level will be achieved by 2030 in St. Louis, USA. As a solution, Fast-Track Cities-STL opted...
Recent Posts
Society Governance Updates
Society Governance Updates Welcome, Allyson! New President Allyson Beall King joined the Policy Council as our 2024 President. Her primary role is as director of the Washington State University School of the Environment, which focuses on regional ecologies and our...
Call for Presenters: Seminar Series
Call for Presenters: Seminar Series We at the System Dynamics Society are continually seeking vibrant and knowledgeable presenters for our ongoing Seminar Series. As we unfold the calendar, there’s always a place for more insights, experiences, and expertise to enrich...
Honoring Excellence: A Glimpse into the Awards of the International System Dynamics Conference
Honoring Excellence: A Glimpse into the Awards of the International System Dynamics Conference The International System Dynamics Conference brings together experts, practitioners, and students to exchange ideas, showcase real-world applications, and celebrate...
Upcoming Events
Virtual Career Fair by MINDS & SDS
The Master students in System Dynamics at the University of Bergen, in partnership with the System Dynamics Society, are excited to host an enriching Virtual Career Fair. This event is designed to connect students, alumni, and professionals in the field of System...

A Digital Twin Business Model in 40 Hours
Though long past the date when I should have ‘retired’, I just can’t resist interesting projects, like the one a new friend brought me a few weeks ago. It concerns a small but fast-growing B2B business, providing a management-system SAAS platform for a certain type of real estate company.
The business model is essentially simple. The company gets revenue from [a] implementation fees as clients come on board and [b] continuing SAAS fees from live clients already using the system. Operating costs are dominated by staff in the various teams – sales and marketing, platform development, client onboarding, and customer support. Then there are the costs of running the SAAS platform and the usual overheads of finance, HR, and premises.
The initial problem? … Clients have questions or problems with the platform, so raise support-request ‘tickets’. A support team works to resolve those tickets. Although they already struggle to cope with the rate these tickets arrive, the business expects to double in size this year, and keeps adding new features to the system! So, you may say – hire more staff! But it takes months to learn about the platform and how to resolve client issues, so new staff contribute little to solving tickets and need to be coached while they are learning by the very people who are already struggling to cope.
Meanwhile, new clients must be ‘on-boarded’ – getting them on the system and learning how to use it. But the onboarding team, too, can’t cope with the rate of new clients and the ever-growing feature-set, so those new clients ‘go live’ with too little understanding of the system, so they raise still more tickets. Even after onboarding, ‘novice’ clients continue to raise 3x the rate of tickets of more mature clients.
The wider system. The business has captured the most valuable potential clients over the last 4 years – those with the largest property portfolios, the greatest need for the platform, the highest revenue potential, but also the greatest demand for platform functionality. So the platform developers are under constant pressure to build and release new features. And that pressure means features are released with too many bugs, which leads to more support tickets.
Those tickets come in 3 types – easy “How do I do this?” questions; complaints about things that don’t work; and more complex implementation challenges. So the support team is split in 3 groups too. The overload for each team means that backlogs of unsolved tickets build up. When those backlogs get unacceptable, they have to run “ticket-bashing” sessions when anyone who can help gives up extra time to clear the backlogs. And those sessions are happening more and more often. This puts pressure on the staff, risking a rise in turnover and further loss of even the limited support capacity that exists.
The onboarding team already struggles with existing features, and all new features come with unknown bugs, in spite of developers’ efforts to find them. So clients get new features OK, but fall over more bugs as a result … so the support team gets more support tickets to handle … but they don’t understand the new features either.
And, because the best clients have already been won, the business has no choice but to go for the mid-and small-scale clients. But those clients are harder to win – they have to be made aware, have the platform’s functionality explained, and have to be helped over the challenges that they fear will arise if they adopt it. And then those smaller clients deliver less value when they are won! And they don’t have great staff resources themselves, so they generate proportionally more support requests. Except that they don’t need the fancy extra functionality demanded by the top-range clients.
What my friend needs. First, he needed to just get a handle on the growing imbalance between the flow of support tickets and the capacity of the service team to deal with those requests. So that’s what the initial model did. It showed just how badly the problem would escalate over coming weeks if nothing changed, and pointed to solutions.
But he wanted more than just a working model of the support team’s workload because he could see that was just a symptom of a more complex set of issues, encompassing the whole business, all the way from initial marketing right through to the product development and staffing that has to happen. And of course, he and his colleagues need to understand not only where business development and performance may be going, but the financial implications as well.
So he needs a complete “digital twin” business model, playing out how everything in the system changes over time – platform IT development; marketing and partner acquisition, promotion and sales to 3 client segments, client on-boarding and support; all that ticket-handling across 3 teams; the staff development for all these activities; and all the financial results. And because things change constantly, typical quarterly results and monthly management reports are no use – he needs a model showing how the business is working week by week.
To understand what is going on, we need history – and because the issues surfacing today were triggered by events way back in the past, we need a model that starts in 2021 and goes out to 2024 and beyond.
What we did. My friend is the perfect client – he really “gets” how a living business model works, how powerful it could be, and how to guide its development. And he is willing to put in the hard yards to chase down the data needed. (At least this business has the data, which is often not true. In those cases, we have to estimate and triangulate between known items to fill in the gaps).
So I actually had the lighter load in all this. I spent some 40 hours building the model with the client’s guidance. He put in twice that effort to get that data and figure out with colleagues what had really been happening.
BUT we did it! – a complete digital-twin model that they can now use to work out priorities and policies to fix the current challenges and get the business in a state where it can grow, sustainably, into the future. And do so without the pressures and crises that currently risk overwhelming it. And all by relentlessly following the 4 steps of the strategy dynamics method you can discover in our online course on how to build dynamic business models:
Dynamic Business Modeling
An online course that guides you in creating a quantified, simulated “digital twin” of your business, highlighting inter-dependencies and feedback points.
Society members get a 20% discount
Recent Posts
Call for Presenters: Seminar Series
Call for Presenters: Seminar Series We at the System Dynamics Society are continually seeking vibrant and knowledgeable presenters for our ongoing Seminar Series. As we unfold the calendar, there’s always a place for more insights, experiences, and expertise to enrich...
Honoring Excellence: A Glimpse into the Awards of the International System Dynamics Conference
Honoring Excellence: A Glimpse into the Awards of the International System Dynamics Conference The International System Dynamics Conference brings together experts, practitioners, and students to exchange ideas, showcase real-world applications, and celebrate...
From Bergen to Global: UiB’s System Dynamics Group
From Bergen to Global: UiB’s System Dynamics Group The System Dynamics Group, an autonomous research group at the University of Bergen (UiB) was established in 1971 by professor emeritus Svein Nordbotten. Inspired by the work of Jay W. Forrester, Nordbotten...
Upcoming Events
Virtual Career Fair by MINDS & SDS
The Master students in System Dynamics at the University of Bergen, in partnership with the System Dynamics Society, are excited to host an enriching Virtual Career Fair. This event is designed to connect students, alumni, and professionals in the field of System...
Recent Business cases
A Design Value Calculator: A System Dynamics Boardgame
A Design Value Calculator: A System Dynamics Boardgame EXECUTIVE Summary Product design is a specific form of complex innovation that touches all areas of an organization’s management. While entrepreneurs recognise the value of design, they often tend to focus...
The World Bank Uses System Dynamics to Identify Root Causes of Poverty
The World Bank Uses System Dynamics to Identify Root Causes of Poverty EXECUTIVE Summary Madagascar has one of the highest poverty rates in the world. In 2022, an astonishingly three out of every four people in Madagascar lived below the poverty line. Poverty has...
Fast-Track Cities Uses System Dynamics to Enhance HIV Care
Fast-Track Cities Uses System Dynamics to Enhance HIV Care EXECUTIVE Summary Low levels of viral suppression at 69% for people with HIV make it hard to believe the 95% target level will be achieved by 2030 in St. Louis, USA. As a solution, Fast-Track Cities-STL opted...
Join us

System Dynamics Helps Farmers Escape Poverty Trap in Guatemala
EXECUTIVE Summary
Guatemala holds the 4th highest global ranking for chronic malnutrition, and climate change is intensifying the challenges subsistence farmers face in providing food for their families. Utilizing a System Dynamics model facilitated meaningful discussions among various stakeholders and government entities, ultimately leading to the provision of strategic resources, such as livestock and expert guidance, for 152 families. This support enabled farmers to break free from the poverty trap and make valuable investments in their agricultural endeavors.
The System Dynamics model effectively illustrated the interplay between numerous variables, empowering farmers to comprehend and take control of key leverage points essential for their well-being and prosperity.
#Food security #Farmers #Agriculture #Guatemala
The Problem
Guatemala faces a staggering 55% prevalence of chronic malnutrition (a widely recognized indicator of food insecurity) in rural areas and ranks as 4th worst globally. Climate change is amplifying the difficulties subsistence farmers in Guatemala face in providing food for their families. Although climate change affects all food producers in various ways, subsistence farmers are especially vulnerable due to their limited access to irrigation and crop insurance, which could help mitigate the effects of fluctuating weather conditions. Furthermore, because subsistence farmers depend on their own production to feed themselves and their families, low yields and crop loss often result in malnutrition and starvation.
This underscores the need to understand how local farmers can collaborate and work with both local and central governments to enhance their food security.

The Solution
The model was developed using Group Model Building (GMB) and stakeholder engagement in two distinct communities. In each case, we collaborated with farmers and representatives from central and local governments to create causal loop diagrams that illustrated the primary relationships within their respective food systems and the variables influencing food security resilience in the face of climate change. This understanding was then converted into quantitative System Dynamics (SD) models, which facilitated discussions regarding potential policies.
The model comprises five main components:
-
Maize local market: This component captures the primary dynamics of the local market using a traditional commodity model.
-
Households: This element represents the dynamics affecting household cash availability and purchasing power, with revenues generated from maize production, livestock, and other activities.
-
Livestock: This component illustrates the primary dynamics of livestock (specifically poultry) production on local farms.
-
Soil: This part demonstrates the dynamics of organic nitrogen and organic carbon in the soil.
-
Water and irrigation: This component captures the infrastructure used for irrigation and exogenous variables like rainfall.
The model features three main feedback loops:
-
Commercial agriculture (R1): Revenue from maize increases household cash, which enhances their ability to invest in farming (such as seeds, fertilizers, and irrigation systems), resulting in improved soil quality and increased water uptake.
-
Poverty trap (R2): A portion of maize production is allocated for self-consumption. The higher the proportion dedicated to self-consumption, the less maize is available for the market, which reduces revenue and subsequently investment in farming. Low investment in farming leads to low yields, further decreasing the amount of maize that can be sold.
-
Reserves driving wellbeing (R3): Higher production rates result in more maize being available for self-consumption, reducing the need to spend money on purchasing food. This increases farmers’ available cash for investing in the next year’s harvest.

Outcomes
The policy recommendations from our study were utilized by local NGOs and government representatives to lobby their representatives in parliament and the Minister of Agriculture (MAGA). As suggested in the report, 152 families were provided with livestock in small quantities and supported by technical experts to develop small production farms.
This demonstrates the compelling nature of using System Dynamics in addressing complex issues, such as food security in the context of climate change. System Dynamics enabled to graphically represented the system through causal loop diagrams, providing a crucial visual aid that facilitated communication with local stakeholders in a way that other modeling approaches, mainly focused on mathematical formulations, could not achieve. Further, the emphasis on stocks in System Dynamics allowed for the effective representation of food stocks and key resources like soil organic matter, while maintaining model simplicity.
OTHER SUCCESSFUL APPLICATIONS
A Design Value Calculator: A System Dynamics Boardgame
A Design Value Calculator: A System Dynamics Boardgame EXECUTIVE Summary Product design is a specific form of complex innovation that touches all areas of an organization’s management. While entrepreneurs recognise the value of design, they often tend to focus...
The World Bank Uses System Dynamics to Identify Root Causes of Poverty
The World Bank Uses System Dynamics to Identify Root Causes of Poverty EXECUTIVE Summary Madagascar has one of the highest poverty rates in the world. In 2022, an astonishingly three out of every four people in Madagascar lived below the poverty line. Poverty has...
Fast-Track Cities Uses System Dynamics to Enhance HIV Care
Fast-Track Cities Uses System Dynamics to Enhance HIV Care EXECUTIVE Summary Low levels of viral suppression at 69% for people with HIV make it hard to believe the 95% target level will be achieved by 2030 in St. Louis, USA. As a solution, Fast-Track Cities-STL opted...
Upcoming Events
Virtual Career Fair by MINDS & SDS
The Master students in System Dynamics at the University of Bergen, in partnership with the System Dynamics Society, are excited to host an enriching Virtual Career Fair. This event is designed to connect students, alumni, and professionals in the field of System...
Recent Posts
Society Governance Updates
Society Governance Updates Welcome, Allyson! New President Allyson Beall King joined the Policy Council as our 2024 President. Her primary role is as director of the Washington State University School of the Environment, which focuses on regional ecologies and our...
Call for Presenters: Seminar Series
Call for Presenters: Seminar Series We at the System Dynamics Society are continually seeking vibrant and knowledgeable presenters for our ongoing Seminar Series. As we unfold the calendar, there’s always a place for more insights, experiences, and expertise to enrich...
Honoring Excellence: A Glimpse into the Awards of the International System Dynamics Conference
Honoring Excellence: A Glimpse into the Awards of the International System Dynamics Conference The International System Dynamics Conference brings together experts, practitioners, and students to exchange ideas, showcase real-world applications, and celebrate...
Join us
OTHER SUCCESSFUL APPLICATIONS
A Design Value Calculator: A System Dynamics Boardgame
A Design Value Calculator: A System Dynamics Boardgame EXECUTIVE Summary Product design is a specific form of complex innovation that touches all areas of an organization’s management. While entrepreneurs recognise the value of design, they often tend to focus...
The World Bank Uses System Dynamics to Identify Root Causes of Poverty
The World Bank Uses System Dynamics to Identify Root Causes of Poverty EXECUTIVE Summary Madagascar has one of the highest poverty rates in the world. In 2022, an astonishingly three out of every four people in Madagascar lived below the poverty line. Poverty has...
Fast-Track Cities Uses System Dynamics to Enhance HIV Care
Fast-Track Cities Uses System Dynamics to Enhance HIV Care EXECUTIVE Summary Low levels of viral suppression at 69% for people with HIV make it hard to believe the 95% target level will be achieved by 2030 in St. Louis, USA. As a solution, Fast-Track Cities-STL opted...
Recent Posts
Society Governance Updates
Society Governance Updates Welcome, Allyson! New President Allyson Beall King joined the Policy Council as our 2024 President. Her primary role is as director of the Washington State University School of the Environment, which focuses on regional ecologies and our...
Call for Presenters: Seminar Series
Call for Presenters: Seminar Series We at the System Dynamics Society are continually seeking vibrant and knowledgeable presenters for our ongoing Seminar Series. As we unfold the calendar, there’s always a place for more insights, experiences, and expertise to enrich...
Honoring Excellence: A Glimpse into the Awards of the International System Dynamics Conference
Honoring Excellence: A Glimpse into the Awards of the International System Dynamics Conference The International System Dynamics Conference brings together experts, practitioners, and students to exchange ideas, showcase real-world applications, and celebrate...
Upcoming Events
Virtual Career Fair by MINDS & SDS
The Master students in System Dynamics at the University of Bergen, in partnership with the System Dynamics Society, are excited to host an enriching Virtual Career Fair. This event is designed to connect students, alumni, and professionals in the field of System...
Planning and Managing Performance Improvement Programs
See also a more extensive article based on this post, and watch the recording below on the topic.
Organizations of all sizes and types undertake programs of effort to improve their performance, whether it’s in the areas of health and safety, net-zero efforts, or digital transformation. But sustaining momentum for such efforts is tough, and many fail completely.
It turns out that such programs share a common structure, which can be used to assess how the program may progress, how benefits may grow over time, and the cost and effort of achieving them (figure 1).
Performance-improvement programs generally aim to eliminate or mitigate some problematic outcomes such as staff injuries, the loss of critical data, excessive energy use, and inefficient business processes. Those problematic outcomes are caused by previously unidentified problem drivers – hazards in business facilities, data vulnerabilities, inefficient or under-controlled energy-using assets, and inefficient business processes.
So the basic aim is to eliminate or mitigate those problem drivers. This essentially consists of two overlapping efforts [1] to find and quantify those problem drivers, then [2] to eliminate or mitigate those problem drivers that are found.
As benefits start to become apparent, two self-reinforcing mechanisms (R) kick in. First, the staff becomes engaged in its success and adds – often greatly – to the discovery of those unknown opportunities. This boosts leaders’ confidence, so financial savings from the program can be recycled to speed up the rate at which benefits are realized.
In due course, we run out of unknown opportunities to find, and the cost-benefit of remaining opportunities declines – two balancing mechanisms (B) that ultimately limit the benefits that can be gained.
Figure 1 – The overall structure of the system that underlies improvement programs.

Reviewing real-world cases revealed how the principles above actually work in practice. One example concerned a 2-year effort on energy-saving by a large ready-meals producer operating several facilities.
Management appointed an energy manager, who soon brought monthly reports to the executive team, itemizing savings opportunities and specifying their impact, cost, and implementation steps. Those opportunities brought further benefits, such as lower maintenance costs and production downtime. The visible benefits led to staff adopting energy-saving behavior and finding still more opportunities. In under 2 years, the program saved 40% of the organization’s energy use – with no significant capital investment. Future investment will drive down energy use still further.
The structure in figure 1 can be quantified and modeled, then used to manage the program over time (A demonstration model is available at sdl.re/EnergySaving1, and a simple guide for its software is at sdcourses.com/silico-guide).
Background
The figure 1 framework and the working models that prove its value emerged from work for the British Standards Institution (BSI). BSI publishes internationally-recognized “ISO” management standards on a very wide range of topics. BSI commissioned a series of “serious games” to show the key choices and impact of adopting Standards – explore the first few games here, all built on working models of figure 1. BSI also wanted a game to encourage small-to-medium enterprises (SMEs), to drive down greenhouse gas emissions. See The NetZero Challenge.
Figure 2 –The results screen of the NetZero Challenge game

Watch the recording below
Whoops, this recording is available for members and ticket purchasers only. Please login to verify. If you’re not a member, purchase a membership here. You can also buy a ticket to watch the recording here.
About the Speaker
Kim Warren is an experienced strategy professional, teacher, and publisher of online courses and teaching resources on business modeling – fast becoming a mainstream capability for executives, consultants, and business students. He was awarded the Jay Wright Forrester Award by the International System Dynamics Society in 2005 and was the Society’s President in 2013.
Recent Posts
Call for Presenters: Seminar Series
Call for Presenters: Seminar Series We at the System Dynamics Society are continually seeking vibrant and knowledgeable presenters for our ongoing Seminar Series. As we unfold the calendar, there’s always a place for more insights, experiences, and expertise to enrich...
Honoring Excellence: A Glimpse into the Awards of the International System Dynamics Conference
Honoring Excellence: A Glimpse into the Awards of the International System Dynamics Conference The International System Dynamics Conference brings together experts, practitioners, and students to exchange ideas, showcase real-world applications, and celebrate...
From Bergen to Global: UiB’s System Dynamics Group
From Bergen to Global: UiB’s System Dynamics Group The System Dynamics Group, an autonomous research group at the University of Bergen (UiB) was established in 1971 by professor emeritus Svein Nordbotten. Inspired by the work of Jay W. Forrester, Nordbotten...
Upcoming Events
Virtual Career Fair by MINDS & SDS
The Master students in System Dynamics at the University of Bergen, in partnership with the System Dynamics Society, are excited to host an enriching Virtual Career Fair. This event is designed to connect students, alumni, and professionals in the field of System...
Recent Business cases
A Design Value Calculator: A System Dynamics Boardgame
A Design Value Calculator: A System Dynamics Boardgame EXECUTIVE Summary Product design is a specific form of complex innovation that touches all areas of an organization’s management. While entrepreneurs recognise the value of design, they often tend to focus...
The World Bank Uses System Dynamics to Identify Root Causes of Poverty
The World Bank Uses System Dynamics to Identify Root Causes of Poverty EXECUTIVE Summary Madagascar has one of the highest poverty rates in the world. In 2022, an astonishingly three out of every four people in Madagascar lived below the poverty line. Poverty has...
Fast-Track Cities Uses System Dynamics to Enhance HIV Care
Fast-Track Cities Uses System Dynamics to Enhance HIV Care EXECUTIVE Summary Low levels of viral suppression at 69% for people with HIV make it hard to believe the 95% target level will be achieved by 2030 in St. Louis, USA. As a solution, Fast-Track Cities-STL opted...
Join us
RSC Uses System Dynamics to Increase HVACR Sales Against the Tide
“Using the proven Strategy Dynamic process focused our limited resources on organizing strategic issues, identifying the critical resources, and developing the insight to more rapidly create intuitive and actionable business strategy.”―Warren Farr, CEO, Refrigeration Sales Corporation
System Dynamic’s benefits do not have to be driven by outside consulting efforts. Sometimes, internal education and training lead to insights which cause a company to thrive and even evolve during the most tumultuous times. Take Refrigeration Sales Corp (RSC), during the downturn of the late 2000s. CEO-turned-modeler, Warren Farr, was able to see RSC’s revenue go up 25% in a market that saw sales go through a 25% decline, thanks to forecasts driven by SD modeling and insights gained during the process of developing those models.
RSC is a third generation privately owned family business located in Ohio, USA specializing in wholesale sales and support of Heating, Ventilation, AC and Refrigeration (HVACR) units. Over the years the company had expanded its business beyond just equipment sales to credit lending, technical support and training for many thousands of statewide contractors. At the time the HVACR industry itself had enjoyed three decades of continuous growth, and RSC had seen annual AC sales increases averaging 10%. But for the first time in years, these annual sales rates were decreasing. Competitors, and the company’s own customers, believed this to be a “temporary lull” caused by the economy as a whole and, along with more cautious suppliers, most parties were optimistic for the future. However, Warren, who had just taken the first of several courses in System Dynamics, believed that recent trends in 2001 signaled a new phase in the market’s development and that this historic growth would inevitably slow down more permanently.
Applying System Dynamics
Inspired by the notion of feedback stemming from inside the system rather than external causes, Warren applied the SD methodology to create long-term market forecasts; ones which were crucial to a company whose sales and profits were tied directly to the fortunes of market volume. Working off of the three views of the future in the figure below, Warren sought to find the underlying truth of the industry. While suppliers and customers were sticking with the “hope” prediction, and the company’s management was preparing for the “best guess”, information on the market’s installed base showed clearly that the “fear” scenario was in fact the appropriate response to prepare for.
A key systemic insight is this. The nature of durable goods, is that they are, well, durable. Sales levels for a durable product have the shape of a bell curve; sales of new units increase until the market becomes saturated, at which point new sales are mostly replacement or upgrades. Warren’s competitors and customers were blind to this basic truth, and fully expected demand to start rising again with the next recovery in the economy and in construction.
This saturation effect is simple enough to state – but how significant would it be, and over what time-scale would it play out? The dynamic model quantified the accumulation of the installed-base and internalized the feedback of declining first-time sales, allowing managers to observe reality playing out and refine their intuitions about the ebbs and flows of the industry’s growth cycle.
Not only was the approaching saturation point reducing the installation base for new AC units, but in a northern U.S. region like Ohio where an AC unit could last for 15 to 20 years, replacement sales were unlikely to fuel growth either. The model was predicting a 20% to 30% contraction in sustainable annual unit sales, which would be considered catastrophic in most markets.
U.S. Regulations Delay Market Contraction
The reaction to these insights was swift and not without controversy. In the years 2004 and 2005, sales spiked even higher than the hopeful prediction thanks to new US Dept. of Energy regulations which were causing contractors to stock up on older AC units before new minimum efficiency requirements took place and raised prices. But RSC stuck to its forecasting model. In an industry which had known nothing but growth for decades, RSC was downsizing its workforce, tightening customer credit limits and consolidating its inventory and warehouses. Both suppliers and customers thought these actions were short-sighted according to common industry logic and current record sales. But RSC’s uncommon logic would swiftly prove itself as the predicted market contraction came true. After 2005, sales entered an unprecedented crash, setting the market average back down to 1994 levels.
“The modeling provided a longer-term perspective, allowing RSC management to make these dramatic changes in company bandwidth over a period of about 3 years, avoiding the excess cost associated with rapid ‘cutting’.” ―Warren Farr, CEO, Refrigeration Sales Corporation
Forecasting Leads to Market Share Growth
Thanks to their SD forecasting efforts, RSC changes were proactive and planned, and not reactive with unintended consequences. Though RSC would have survived the industry downturn without modeling, the company was now in a prime position to diversify and take on new market share as competitors sought to shed expenses in a bid to stay afloat. New talents, territories, and market shares were taken from unprepared firms scrambling to adapt to the crash. In territories where the AC market saw a 30% contraction from 2000 to 2010, RSC saw a 25% increase in annual revenues and 30% increase in its sales locations.
RSC’s story highlights a number of points. First, managers need to regularly ‘step outside’ the day-to-day crush of business activity, and understand the fundamentals of what is happening in the market around them. Second, just being aware of principles – like market saturation – may not be enough. Often what is needed is modeling work to figure out the quantified, time-based consequences of these dynamics. Third, the company’s work highlights the advantage of making decisions with forethought and examination, rather than waiting for the impact of new market conditions to throw off business plans. The story reflects the simple but powerful insights that System Dynamics can bring to such questions. Clearly, RSC’s strategic change decision was very significant, enabling them to create new advantages over the competition.
Lastly, we can see that System Dynamics is not some highly technical tool only accessible to math whizzes, but a practical, accessible method that smart managers like CEO Warren Farr can learn to use to great effect.
OTHER SUCCESSFUL APPLICATIONS
A Design Value Calculator: A System Dynamics Boardgame
A Design Value Calculator: A System Dynamics Boardgame EXECUTIVE Summary Product design is a specific form of complex innovation that touches all areas of an organization’s management. While entrepreneurs recognise the value of design, they often tend to focus...
The World Bank Uses System Dynamics to Identify Root Causes of Poverty
The World Bank Uses System Dynamics to Identify Root Causes of Poverty EXECUTIVE Summary Madagascar has one of the highest poverty rates in the world. In 2022, an astonishingly three out of every four people in Madagascar lived below the poverty line. Poverty has...
Fast-Track Cities Uses System Dynamics to Enhance HIV Care
Fast-Track Cities Uses System Dynamics to Enhance HIV Care EXECUTIVE Summary Low levels of viral suppression at 69% for people with HIV make it hard to believe the 95% target level will be achieved by 2030 in St. Louis, USA. As a solution, Fast-Track Cities-STL opted...
Upcoming Events
Virtual Career Fair by MINDS & SDS
The Master students in System Dynamics at the University of Bergen, in partnership with the System Dynamics Society, are excited to host an enriching Virtual Career Fair. This event is designed to connect students, alumni, and professionals in the field of System...
Recent Posts
Society Governance Updates
Society Governance Updates Welcome, Allyson! New President Allyson Beall King joined the Policy Council as our 2024 President. Her primary role is as director of the Washington State University School of the Environment, which focuses on regional ecologies and our...
Call for Presenters: Seminar Series
Call for Presenters: Seminar Series We at the System Dynamics Society are continually seeking vibrant and knowledgeable presenters for our ongoing Seminar Series. As we unfold the calendar, there’s always a place for more insights, experiences, and expertise to enrich...
Honoring Excellence: A Glimpse into the Awards of the International System Dynamics Conference
Honoring Excellence: A Glimpse into the Awards of the International System Dynamics Conference The International System Dynamics Conference brings together experts, practitioners, and students to exchange ideas, showcase real-world applications, and celebrate...
Join us
OTHER SUCCESSFUL APPLICATIONS
A Design Value Calculator: A System Dynamics Boardgame
A Design Value Calculator: A System Dynamics Boardgame EXECUTIVE Summary Product design is a specific form of complex innovation that touches all areas of an organization’s management. While entrepreneurs recognise the value of design, they often tend to focus...
The World Bank Uses System Dynamics to Identify Root Causes of Poverty
The World Bank Uses System Dynamics to Identify Root Causes of Poverty EXECUTIVE Summary Madagascar has one of the highest poverty rates in the world. In 2022, an astonishingly three out of every four people in Madagascar lived below the poverty line. Poverty has...
Fast-Track Cities Uses System Dynamics to Enhance HIV Care
Fast-Track Cities Uses System Dynamics to Enhance HIV Care EXECUTIVE Summary Low levels of viral suppression at 69% for people with HIV make it hard to believe the 95% target level will be achieved by 2030 in St. Louis, USA. As a solution, Fast-Track Cities-STL opted...
Recent Posts
Society Governance Updates
Society Governance Updates Welcome, Allyson! New President Allyson Beall King joined the Policy Council as our 2024 President. Her primary role is as director of the Washington State University School of the Environment, which focuses on regional ecologies and our...
Call for Presenters: Seminar Series
Call for Presenters: Seminar Series We at the System Dynamics Society are continually seeking vibrant and knowledgeable presenters for our ongoing Seminar Series. As we unfold the calendar, there’s always a place for more insights, experiences, and expertise to enrich...
Honoring Excellence: A Glimpse into the Awards of the International System Dynamics Conference
Honoring Excellence: A Glimpse into the Awards of the International System Dynamics Conference The International System Dynamics Conference brings together experts, practitioners, and students to exchange ideas, showcase real-world applications, and celebrate...
Upcoming Events
Virtual Career Fair by MINDS & SDS
The Master students in System Dynamics at the University of Bergen, in partnership with the System Dynamics Society, are excited to host an enriching Virtual Career Fair. This event is designed to connect students, alumni, and professionals in the field of System...