
System Dynamics Helps Evaluate Anticipatory Action on Cholera Outbreaks
EXECUTIVE Summary
-
Cholera remains a significant public health problem in the Democratic Republic of the Congo (DRC), with 13,000 suspected cases and 236 deaths reported in 2022 alone. In light of these complexities and volatilities, it is crucial for humanitarian response to move from a largely reactive to an anticipatory approach according to the Centre for Humanitarian Data.
-
The System Dynamics model plays a substantial role in the learning process of the anticipatory action pilot project, by simulating various scenarios involving different anticipatory actions. The case-area targeted intervention (CATI) approach involves the early detection of primary outbreak cases and delivery of a rapid response to households around the case’s household to substantially reduce transmission via synergistic interventions that act in the short term (i.e. point-of-use water treatment, hygiene promotion with soap distribution, and antibiotic chemoprophylaxis).
-
Depending on the timing and the capacity of the anticipatory activities, the model findings demonstrate positive outcomes from early interventions, with up to 40% of deaths potentially avoided. Moreover, the findings highlight the critical role of anticipatory approach in buying more time for vaccination efforts.
#Cholera #DisasterResponse #Outbreak #DRC
The Problem
The Democratic Republic of Congo (DRC) is grappling with one of the world’s most complex and prolonged humanitarian crises, suffering from mass population displacement, acute food insecurity, severe malnutrition, epidemics, and protection issues. Cholera is endemic, particularly in the conflict-ridden eastern provinces, which accounted for 89% of the country’s cases and 62% of its deaths in 2022. Furthermore, outbreaks also occur in non-endemic areas. The situation is complicated by administrative and logistical challenges, the isolation of some regions, and a deteriorating security situation, making humanitarian responses exceptionally difficult.
Despite a decrease in cholera cases since 2019, the fatality rate has increased, and the Ministry of Health reports a rise in cases in 2022. There is a convergence of points of view of international humanitarian aid, according to which there must me a move from a largely reactive to an anticipatory approach. This involves planning for the occurrence of a next disaster: setting up an action plan and securing funding before the disaster hits, disburse funds to reduce an outbreak impact, and, therefore, mitigate humanitarian needs.
The Solution
Today, the occurrence and the impact of humanitarian interventions on different crisis can be projected with high confidence. Evidence indicates that proactive action before a foreseeable threat materialises is more effective than traditional reactive humanitarian responses. The System Dynamics model of Yemen Cholera Response modeled by Loo, Anaely, and Kopainsky (2022) explores the implications of the joint interventions with different start times and demonstrates that 40% of deaths could potentially have been prevented if the same interventions had been initiated earlier in April 2017, in Al-Hudaydah, Yemen.
Anticipatory action aims to trigger the release of funds much earlier than is currently the case, in order to respond quickly when cases are detected. Humanitarian agencies encourage collective learning based on the impact from the anticipatory action pilot project in the DRC. By adapting the Yemen Cholera Response model to the DRC context and simulating various anticipatory action scenarios, the System Dynamics model plays a substantial role in the learning process of the anticipatory action pilot project.
The high-level stock and flow diagram illustrates an extended Susceptible, Infectious, and Recovered (SIR) model that integrates the cholera outbreak response’s operational dynamics featuring targeted interventions in water, sanitation, hygiene, data surveillance, and health sectors. The anticipatory action framework prioritises enhancing early detection and curbing the transmission of cholera by mobilising rapid response from the CATI teams. These teams work in homes with suspected cases, distributing water, sanitation and hygiene (WASH) kits, sharing hygiene information, disinfecting these homes and their surroundings, and bolstering surveillance capacity.

The main feedback loops:
Infection loop (Reinforcing feedback loop): This loop describes how susceptible individuals (S) come into contact with infectious individuals (I), leading to an increase in the number of infections.
Recovery and loss of immunity loop (Balancing feedback loop): In this loop, infected individuals recover (R) and move from the infectious category back to the susceptible category due to the loss of immunity over time.
These feedback loops are essential in understanding the dynamics of disease spread and recovery in a population, as well as intervention leverage points.
Outcomes
The model facilitates understanding the impact of single or combined interventions initiated at varying times. In adapting the Yemen Cholera Response model, two additional interventions – water system and CATI – were incorporated into the System Dynamics model.
The findings from the present model are in line with the findings from the Yemen Cholera Response model where both models highlight the critical roles of an anticipatory approach (or other short-term emergency response interventions) in buying more time for vaccination efforts. The System Dynamics model plays a substantial role in the learning process of the anticipatory action pilot project, by simulating various scenarios involving different anticipatory actions.
More importantly, the implementation of the anticipatory action for cholera in the DRC will help foster scientific findings and the refinement of the cholera simulation model, increasing the model confidence and robustness. The next phase aims to incorporate the findings from monitoring and evaluating implemented activities back into the System Dynamics model, thereby bolstering the model’s robustness.

Figure – User interface used for analysing the impacts of interventions with different capacities, demands, and start times.
Do you want to know more?
Connect with Pei Shan Loo and L Milano.
OTHER SUCCESSFUL APPLICATIONS
System Dynamics Helps Evaluate Anticipatory Action on Cholera Outbreaks
Humanitarian agencies encourage anticipatory action in disaster response to cholera outbreaks in the Democratic Republic of Congo.
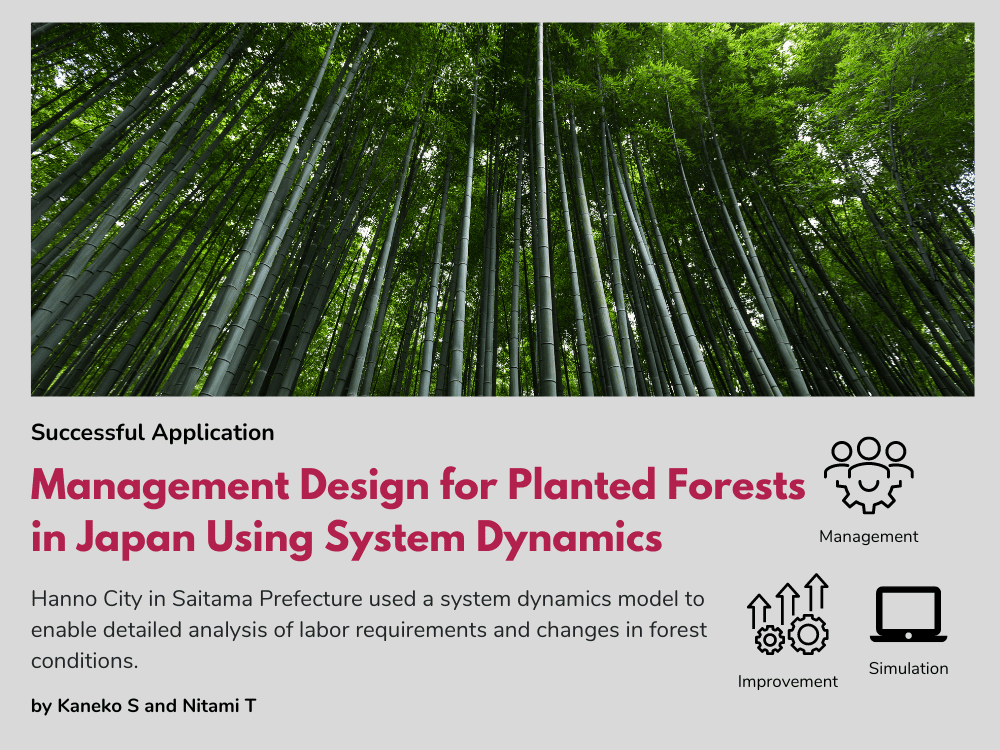
Management Design for Planted Forests in Japan Using System Dynamics
Hanno City in Saitama Prefecture used a system dynamics model to enable detailed analysis of labor requirements and changes in forest conditions.
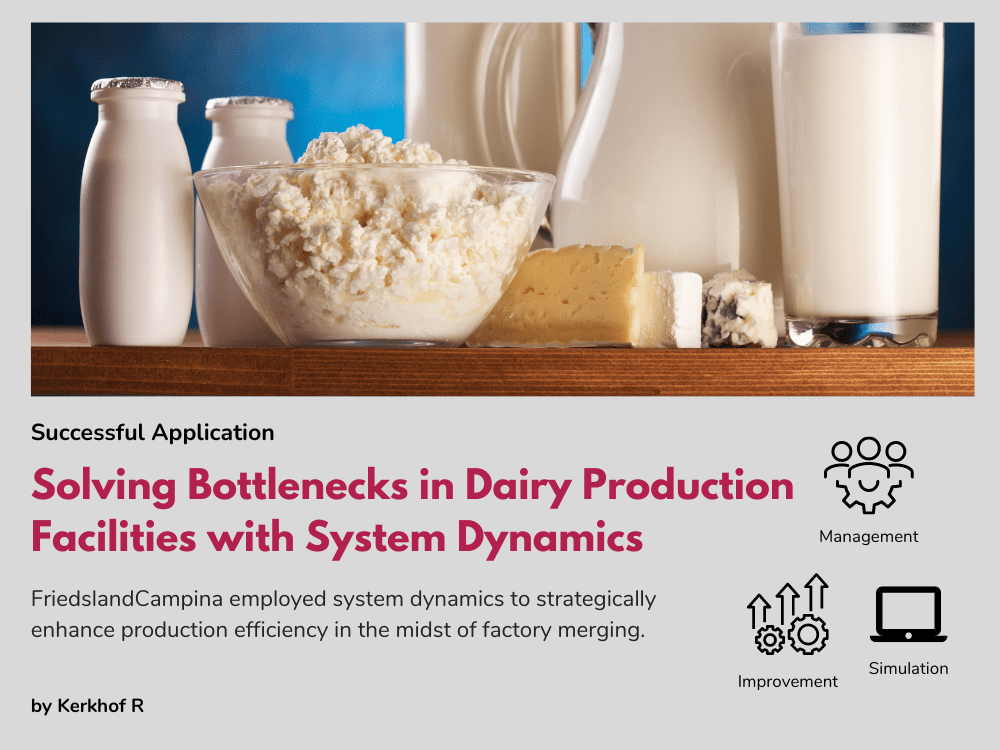
Solving Bottlenecks in Dairy Production Facilities with System Dynamics
FriedslandCampina employed system dynamics to strategically enhance production efficiency in the midst of factory merging.
Upcoming Events

2024 International System Dynamics Conference
The International System Dynamics Conference is coming to Bergen! Save the date: August 4-8, 2024. We hope to see you there! #ISDC2024
Recent Posts
How Did En-ROADS Get 755,000 users? Lessons on Modeling, Interface Design, and Facilitation
This article discusses the En-ROADS climate model, detailing its robust modeling, intuitive interface design, effective facilitation, and strategic policy engagement for global impact.
Society Governance Updates
New System Dynamics Society leadership
Call for Presenters: Seminar Series
Share your insights in the System Dynamics Society Seminar Series. Submit your proposal and join a global community of experts
Join us

OTHER SUCCESSFUL APPLICATIONS
System Dynamics Helps Evaluate Anticipatory Action on Cholera Outbreaks
Humanitarian agencies encourage anticipatory action in disaster response to cholera outbreaks in the Democratic Republic of Congo.
Management Design for Planted Forests in Japan Using System Dynamics
Hanno City in Saitama Prefecture used a system dynamics model to enable detailed analysis of labor requirements and changes in forest conditions.
Solving Bottlenecks in Dairy Production Facilities with System Dynamics
FriedslandCampina employed system dynamics to strategically enhance production efficiency in the midst of factory merging.
Recent Posts
How Did En-ROADS Get 755,000 users? Lessons on Modeling, Interface Design, and Facilitation
This article discusses the En-ROADS climate model, detailing its robust modeling, intuitive interface design, effective facilitation, and strategic policy engagement for global impact.
Society Governance Updates
New System Dynamics Society leadership
Call for Presenters: Seminar Series
Share your insights in the System Dynamics Society Seminar Series. Submit your proposal and join a global community of experts
Upcoming Events
2024 International System Dynamics Conference
The International System Dynamics Conference is coming to Bergen! Save the date: August 4-8, 2024. We hope to see you there! #ISDC2024
Management Design for Planted Forests in Japan Using System Dynamics
EXECUTIVE Summary
-
The simulation model offers a novel approach to sustainable forest management in Japan, enabling detailed analysis of labor requirements and changes in forest conditions.
-
It enables economic benefits such as stable employment, improved financial planning, and enhanced spatio-temporal analysis for 3D visualization of forestry operations.
-
Environmental sustainability is promoted through operations designed to support reforestation, including planting and thinning.
-
This comprehensive tool empowers regional forestry workers and local governments to devise informed, sustainable management plans based on precise forest stand data.
#HannoCity #Sustainability #Forest #Japan
The Problem
The challenge of sustainable forest management lies in accurately assessing and managing forests at the level of individual stands (a term for forest management units). This issue is especially acute in Japan, where forests consist of many small, varied stands, complicating efforts to develop effective management strategies. Traditionally, forest management plans have relied on the experience of local practitioners or rough estimates, which may not be adequate for the following reasons:
1. Predicting Forest Stand Changes: There’s a notable difficulty in forecasting how each stand will evolve over time.
2. Outcome-based Management Planning: There’s a need for a method to create management plans that start with the end in mind, aiming for specific forest conditions.
3. Sustainable Management Practices: Ensuring that forest management is sustainable over the long term is a challenge.
The focus of this case is on Hanno City in Saitama Prefecture, a region with a significant forestry sector and multiple local sawmills. With planted forests nearing the time for harvest, these mills are expected to become increasingly important in the timber production supply chain.
The Solution
The solution to sustainable forest management challenges is centered around a system dynamics (SD) modeling approach, designed to accurately calculate labor inputs required for a range of forestry activities and the resulting changes in forest conditions. This methodology encompasses a suite of management operations, including planting, weeding, improvement cutting, thinning, final cutting for forests aged 50 to 99 years, and long-term cutting for those over 100 years old. An integral component of this model is a carbon emission calculation module, underscoring the approach’s alignment with environmental sustainability.

In the context of Hanno City, this SD model was utilized to create a forest management simulation over a 30-year period. This simulation predicted an average production of 7,174 cubic meters of logs, which were then designated for use as either building timber or fuel. The model intricately simulates the dynamics of tree density and forest stand age by tracking stock (e.g., tree density per unit area), inflow (e.g., planting and natural deaths), and outflow (e.g., removals due to forestry operations). These elements are grounded in initial data from a comprehensive forest stand database, enhancing the accuracy of management planning.
The model’s architecture is notably sophisticated, featuring an ‘Array’ structure that reflects the complexity of managing multiple forest stands, thereby enabling detailed spatial and temporal analyses. It also incorporates static geographic attributes to identify stands eligible for harvest, ensuring the model’s utility in crafting precise and informed management plans. This approach presents a forward-thinking solution for forest management, offering a detailed, scalable tool that aligns productivity with sustainability objectives, leveraging the depth of system dynamics modeling to navigate the complexities of forestry operations.

Outcomes
The implementation of the system dynamics model in forest management facilitates a nuanced understanding of forest stand changes, enabling regional forestry workers and local governments to craft precise management plans. The model’s application yields several key outcomes and impacts:
• Economic Stability and Employment: By optimizing operations, the model supports the creation of stable, long-term employment opportunities within the forestry sector. This optimization ensures a balanced workload, contributing to economic stability for those involved in forest management.
• Financial Management: It provides a robust framework for calculating revenue, income, and costs associated with forest management activities. This capability enables more accurate financial planning and resource allocation, enhancing the economic viability of forestry operations.
• Technological Integration and Visualization: The model facilitates the export of data on spatio-temporal changes in forests to external tools via spreadsheets. This feature allows for the innovative use of 3D visualization technologies, such as Unity, to model forest development and management scenarios visually. Such visualizations can aid in decision-making, stakeholder engagement, and educational outreach.
• Environmental Sustainability: On the environmental front, the model supports the design of operations that prioritize forestation efforts, including planting and thinning. These practices contribute to the sustainability of forest ecosystems by maintaining healthy forest stands and enhancing biodiversity. Additionally, the ability to model carbon emissions helps align forest management practices with broader environmental and climate goals.
• Regional Forestry Planning: The detailed insights provided by the model into forest stand changes are invaluable for designing sustainable regional forestry strategies. This detailed level of information supports targeted interventions and long-term planning efforts, ensuring that forestry practices contribute positively to both local economies and the environment.
By addressing both financial and environmental aspects of forest management, this model stands as a pivotal tool for advancing sustainable forestry practices, aligning with global sustainability targets and local economic needs.
Do you want to know more?
Connect with Shunsuke Kaneko.
OTHER SUCCESSFUL APPLICATIONS
System Dynamics Helps Evaluate Anticipatory Action on Cholera Outbreaks
Humanitarian agencies encourage anticipatory action in disaster response to cholera outbreaks in the Democratic Republic of Congo.
Management Design for Planted Forests in Japan Using System Dynamics
Hanno City in Saitama Prefecture used a system dynamics model to enable detailed analysis of labor requirements and changes in forest conditions.
Solving Bottlenecks in Dairy Production Facilities with System Dynamics
FriedslandCampina employed system dynamics to strategically enhance production efficiency in the midst of factory merging.
Upcoming Events
2024 International System Dynamics Conference
The International System Dynamics Conference is coming to Bergen! Save the date: August 4-8, 2024. We hope to see you there! #ISDC2024
Recent Posts
How Did En-ROADS Get 755,000 users? Lessons on Modeling, Interface Design, and Facilitation
This article discusses the En-ROADS climate model, detailing its robust modeling, intuitive interface design, effective facilitation, and strategic policy engagement for global impact.
Society Governance Updates
New System Dynamics Society leadership
Call for Presenters: Seminar Series
Share your insights in the System Dynamics Society Seminar Series. Submit your proposal and join a global community of experts
Join us
OTHER SUCCESSFUL APPLICATIONS
System Dynamics Helps Evaluate Anticipatory Action on Cholera Outbreaks
Humanitarian agencies encourage anticipatory action in disaster response to cholera outbreaks in the Democratic Republic of Congo.
Management Design for Planted Forests in Japan Using System Dynamics
Hanno City in Saitama Prefecture used a system dynamics model to enable detailed analysis of labor requirements and changes in forest conditions.
Solving Bottlenecks in Dairy Production Facilities with System Dynamics
FriedslandCampina employed system dynamics to strategically enhance production efficiency in the midst of factory merging.
Recent Posts
How Did En-ROADS Get 755,000 users? Lessons on Modeling, Interface Design, and Facilitation
This article discusses the En-ROADS climate model, detailing its robust modeling, intuitive interface design, effective facilitation, and strategic policy engagement for global impact.
Society Governance Updates
New System Dynamics Society leadership
Call for Presenters: Seminar Series
Share your insights in the System Dynamics Society Seminar Series. Submit your proposal and join a global community of experts
Upcoming Events
2024 International System Dynamics Conference
The International System Dynamics Conference is coming to Bergen! Save the date: August 4-8, 2024. We hope to see you there! #ISDC2024
Solving Bottlenecks in Dairy Production Facilities with System Dynamics
EXECUTIVE Summary
-
FrieslandCampina faced potential bottlenecks in production due to the merging of two factories. They hired SD&Co which employed system dynamics simulation models to predict and manage these issues effectively, ensuring smooth operational integration.
-
The project led to strategic changes, such as optimizing algorithms for pallet selection and adding a conveyor belt system, thereby enhancing efficiency without the need for extensive physical expansion of facilities.
-
The implemented changes have prepared FrieslandCampina to handle increased production volumes and maintain efficiency even in scenarios of partial factory downtime, demonstrating a successful adaptation to the merger’s demands.
#FriedslandCampina #SD&Co #Diary #Netherlands
The Problem
FrieslandCampina, a Dutch cooperative, specializes in transforming milk from dairy farmers into a wide array of dairy products. They were undertaking a significant project: merging two of their production facilities. This merger was anticipated to introduce new challenges, particularly in the filling and palletizing stages, as well as in the operations of their fully automated warehouse. The project was handled by SD&Co and their primary goal was to foresee potential bottlenecks under various post-merger production scenarios. Identifying these potential bottlenecks was crucial to ensure a smooth transition and maintain efficiency. Additionally, SD&Co was tasked with devising strategies to address these bottlenecks in the most effective and efficient manner possible, keeping in mind the operational workflow and the increased scale of production due to the merger.

Figure 1 – FrieslandCampina’s production facility
The Solution
FrieslandCampina faced a significant challenge: implementing changes to their factory could take up to two years. This long time frame posed a risk of reduced production output or the possibility of overinvesting in capacity expansion. The complexity of the situation was heightened by the interconnected nature of the factory and warehouse processes, which made it challenging to accurately predict outcomes using traditional tools like spreadsheets.
To navigate these complexities, SD&Co employed a comprehensive approach by developing four distinct simulation models. Each model varied in scope and level of detail, enabling a thorough analysis of a wide range of production scenarios and potential physical modifications to both the factory and the warehouse. These simulations were instrumental in testing the effects of various changes and understanding their impact on the overall operations.
Thanks to these sophisticated simulation models, FrieslandCampina and its suppliers were able to pinpoint the most effective and efficient solutions. They could identify adjustments to the factory and warehouse that would best accommodate the increased volumes resulting from the merger of the factories. This strategic approach allowed for a well-informed decision-making process, ensuring that the adjustments made were optimally aligned with the new operational requirements.

Figure 2 – Examples of sectors of the system dynamics model developed by SD&Co.

Figure 3 – Overview of simulation dashboards.
Outcomes
In this pivotal project, SD&Co identified the most efficient modifications necessary for the factory and warehouse to handle the increased volumes post-merger. FrieslandCampina, in collaboration with its suppliers, is actively implementing these recommended changes. The key deliverables of this project were the innovative simulation models and a comprehensive presentation detailing the recommended changes. These system dynamics tools provided valuable insights, leading to strategic adjustments within the operational framework of FrieslandCampina.
One significant change was the refinement of the algorithm that manages the selection of pallets for outbound elevators. This adjustment negated the need for physical expansion of the outbound elevators and staging lanes, thereby optimizing existing resources.
Additionally, they introduced a small conveyor belt behind two palletizers to avoid the need for a more extensive and costly redesign of the internal transport system around the palletizers.
Based on the simulation, FrieslandCampina also made a strategic decision to refrain from further investments. The model demonstrated that the new capacity would be adequate across a variety of production scenarios. This included scenarios where parts of the factory might temporarily break down or require maintenance. The project’s outcomes have significantly contributed to the robustness and efficiency of FrieslandCampina’s operations. The implemented changes ensured that the factory and warehouse can smoothly handle increased volumes, while providing a buffer for unforeseen production challenges.
Do you want to know more?
Connect with Roland van de Kerkhof.
OTHER SUCCESSFUL APPLICATIONS
System Dynamics Helps Evaluate Anticipatory Action on Cholera Outbreaks
Humanitarian agencies encourage anticipatory action in disaster response to cholera outbreaks in the Democratic Republic of Congo.
Management Design for Planted Forests in Japan Using System Dynamics
Hanno City in Saitama Prefecture used a system dynamics model to enable detailed analysis of labor requirements and changes in forest conditions.
Solving Bottlenecks in Dairy Production Facilities with System Dynamics
FriedslandCampina employed system dynamics to strategically enhance production efficiency in the midst of factory merging.
Upcoming Events
2024 International System Dynamics Conference
The International System Dynamics Conference is coming to Bergen! Save the date: August 4-8, 2024. We hope to see you there! #ISDC2024
Recent Posts
How Did En-ROADS Get 755,000 users? Lessons on Modeling, Interface Design, and Facilitation
This article discusses the En-ROADS climate model, detailing its robust modeling, intuitive interface design, effective facilitation, and strategic policy engagement for global impact.
Society Governance Updates
New System Dynamics Society leadership
Call for Presenters: Seminar Series
Share your insights in the System Dynamics Society Seminar Series. Submit your proposal and join a global community of experts
Join us
OTHER SUCCESSFUL APPLICATIONS
System Dynamics Helps Evaluate Anticipatory Action on Cholera Outbreaks
Humanitarian agencies encourage anticipatory action in disaster response to cholera outbreaks in the Democratic Republic of Congo.
Management Design for Planted Forests in Japan Using System Dynamics
Hanno City in Saitama Prefecture used a system dynamics model to enable detailed analysis of labor requirements and changes in forest conditions.
Solving Bottlenecks in Dairy Production Facilities with System Dynamics
FriedslandCampina employed system dynamics to strategically enhance production efficiency in the midst of factory merging.
Recent Posts
How Did En-ROADS Get 755,000 users? Lessons on Modeling, Interface Design, and Facilitation
This article discusses the En-ROADS climate model, detailing its robust modeling, intuitive interface design, effective facilitation, and strategic policy engagement for global impact.
Society Governance Updates
New System Dynamics Society leadership
Call for Presenters: Seminar Series
Share your insights in the System Dynamics Society Seminar Series. Submit your proposal and join a global community of experts
Upcoming Events
2024 International System Dynamics Conference
The International System Dynamics Conference is coming to Bergen! Save the date: August 4-8, 2024. We hope to see you there! #ISDC2024
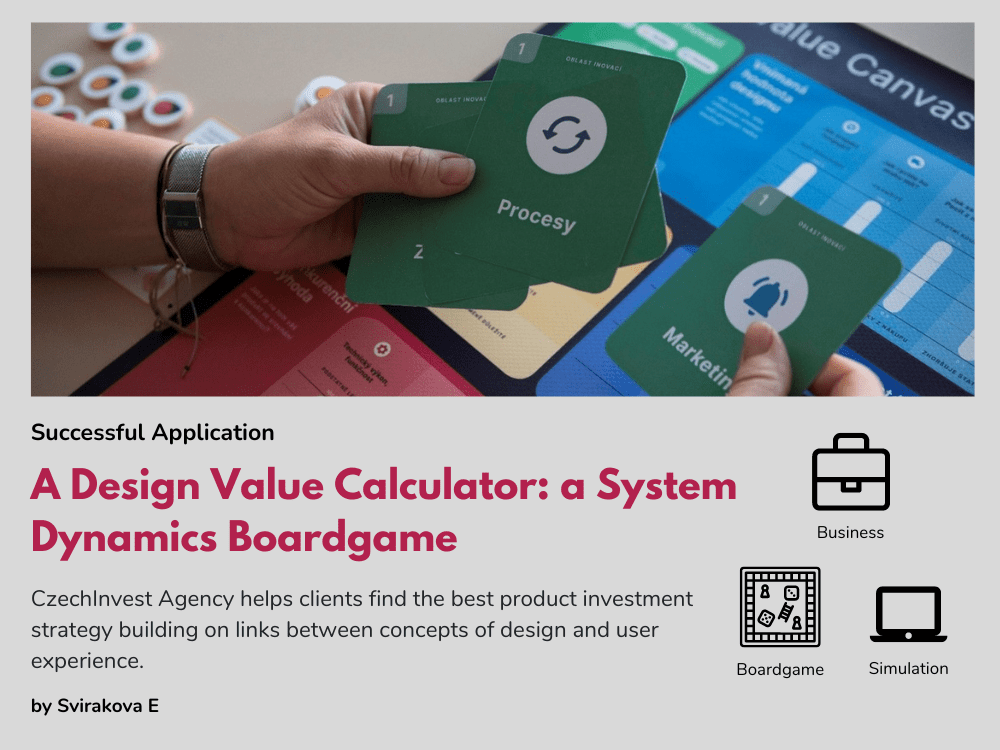
A Design Value Calculator: A System Dynamics Boardgame
EXECUTIVE Summary
-
Product design is a specific form of complex innovation that touches all areas of an organization’s management. While entrepreneurs recognise the value of design, they often tend to focus on areas that customers recognise as important but that they are often already happy with. Helping entrepreneurs to systemically assess the benefits of spending on developing different aspects of the user experience is, hence, fundamental to increase the return over investment and to improve business sustainability.
-
To address this, the CzechInvest Agency developed an interactive board game powered by a System Dynamics model simulator that simulates the economic development of a company over six years and calculates the profitability of changes made to the product design.
-
Based on the game results, the Agency presents opportunities to improve product design. The company’s management can thus objectively identify weaknesses and chooses a strategy to design a better product that improves profits.
#CzechInvest #ProductDesign #Innovation #CzechRepublic
The Problem
Entrepreneurs face a multitude of challenges when it comes to product design, ranging from understanding user needs to navigating technical constraints. One of the primary hurdles is identifying and addressing the true pain points of their target audience. Without a deep understanding of user behavior, preferences, and expectations, entrepreneurs risk developing products that fail to resonate with their intended market.
Additionally, entrepreneurs often fail to understand the concept of product design focusing too much on a particular aspect of their product (often the way it looks) neglecting other aspects of it. While the product presentation is important it is only one part of product design and entrepreneurs need to have a holistic view of the product balancing user-centric design with technical feasibility and cost considerations. In short, entrepreneurs need to ensure that their product ideas are not only desirable but also manufacturable and economically feasible.
The Solution
The solution developed consists of a board game and a complementary System Dynamics model. The game covers five areas of innovation that players can decide to invest on, and the simulation model is used to estimate the performance of these investments. The five areas of innovation players can select by placing a card on the boardgame are: i) services (Služby) ii) Marketing methods, iii) Customer Relationships (Vztahy se zákazníky), iv) Goods and products (Zboží), and v) Internal Company Processes (Procesy).
Once the player has selected an area, the performance of the players decision is estimated using a System Dynamics model designed for this purpose. The figure shows an overview of the building blocks of the System Dynamics model and their links. A customer segment is a group of people or organizations that a company wants to attract and create value for through an appropriate value proposition. The larger the customer segment, the more customer relationships to manage and the busier the distribution channels. Every sale means billing, and billing is a source of revenue. Higher revenue means higher PROFIT for the company, thus growing key resources, one of which is the bank account. The more money in the bank account, the better it is to buy assets, hire new employees, increase product production capacity, and expand the distribution network.

The Design Value Algorithm (DVA) coefficient enters the model in the Customer Segment building block (see figure of the Stock and Flow diagram) and thus influences all other elements in the model. The input of the DVA coefficient to the Customer Segment can also be verified in the Business Algorithms in the Dynamic Business Model illustration.

The winner of the game can be determined either:
a) by the evolution of PROFIT’s cumulative profit with other players.
b) by looking at the impact of the design improvements made during the game.
Outcomes
CzechInvest clients implemented this solution and offers structured interviews to company management. The game demonstrates a systemic link between the concepts of design and user experience and quickly reveals the best strategy for further investment in product design.
Below there are some examples and comments from one of the customers that played the game:
Client Number 1X – XYZ Ltd: “The measured value of design is the difference between the evolution of the PROFIT indicator that the company generates without investing in design (the blue curve in the graph) and the evolution of the profit that the company generates based on the decision to invest in design (the other three curves). The value of design is a dynamic indicator that changes over time.”

Interpretation for the client 1X – XYZ Ltd: “The company needs to invest in design; in this situation, where its average UX is 66%, it is profitable. “
According to the parameters given: the average UX (User Experience) = 0.66. This means that the company can still increase user experience by 34%. However, the manager did not make a strategic decision to earn more on design. Instead, he chose a strategy that is not in line with the company’s potential to increase UX. He placed investments in improving the functionality of the product first and investments in distribution third. In doing so, he identified the lowest UX sub-value in sales. If he wants to serve his customers better, he needs to strategically address sales first.
Do you want to know more?
Visit the Design Value Calculator or connect with Eva Svirakova.
OTHER SUCCESSFUL APPLICATIONS
System Dynamics Helps Evaluate Anticipatory Action on Cholera Outbreaks
Humanitarian agencies encourage anticipatory action in disaster response to cholera outbreaks in the Democratic Republic of Congo.
Management Design for Planted Forests in Japan Using System Dynamics
Hanno City in Saitama Prefecture used a system dynamics model to enable detailed analysis of labor requirements and changes in forest conditions.
Solving Bottlenecks in Dairy Production Facilities with System Dynamics
FriedslandCampina employed system dynamics to strategically enhance production efficiency in the midst of factory merging.
Upcoming Events
2024 International System Dynamics Conference
The International System Dynamics Conference is coming to Bergen! Save the date: August 4-8, 2024. We hope to see you there! #ISDC2024
Recent Posts
How Did En-ROADS Get 755,000 users? Lessons on Modeling, Interface Design, and Facilitation
This article discusses the En-ROADS climate model, detailing its robust modeling, intuitive interface design, effective facilitation, and strategic policy engagement for global impact.
Society Governance Updates
New System Dynamics Society leadership
Call for Presenters: Seminar Series
Share your insights in the System Dynamics Society Seminar Series. Submit your proposal and join a global community of experts
Join us
OTHER SUCCESSFUL APPLICATIONS
System Dynamics Helps Evaluate Anticipatory Action on Cholera Outbreaks
Humanitarian agencies encourage anticipatory action in disaster response to cholera outbreaks in the Democratic Republic of Congo.
Management Design for Planted Forests in Japan Using System Dynamics
Hanno City in Saitama Prefecture used a system dynamics model to enable detailed analysis of labor requirements and changes in forest conditions.
Solving Bottlenecks in Dairy Production Facilities with System Dynamics
FriedslandCampina employed system dynamics to strategically enhance production efficiency in the midst of factory merging.
Recent Posts
How Did En-ROADS Get 755,000 users? Lessons on Modeling, Interface Design, and Facilitation
This article discusses the En-ROADS climate model, detailing its robust modeling, intuitive interface design, effective facilitation, and strategic policy engagement for global impact.
Society Governance Updates
New System Dynamics Society leadership
Call for Presenters: Seminar Series
Share your insights in the System Dynamics Society Seminar Series. Submit your proposal and join a global community of experts
Upcoming Events
2024 International System Dynamics Conference
The International System Dynamics Conference is coming to Bergen! Save the date: August 4-8, 2024. We hope to see you there! #ISDC2024
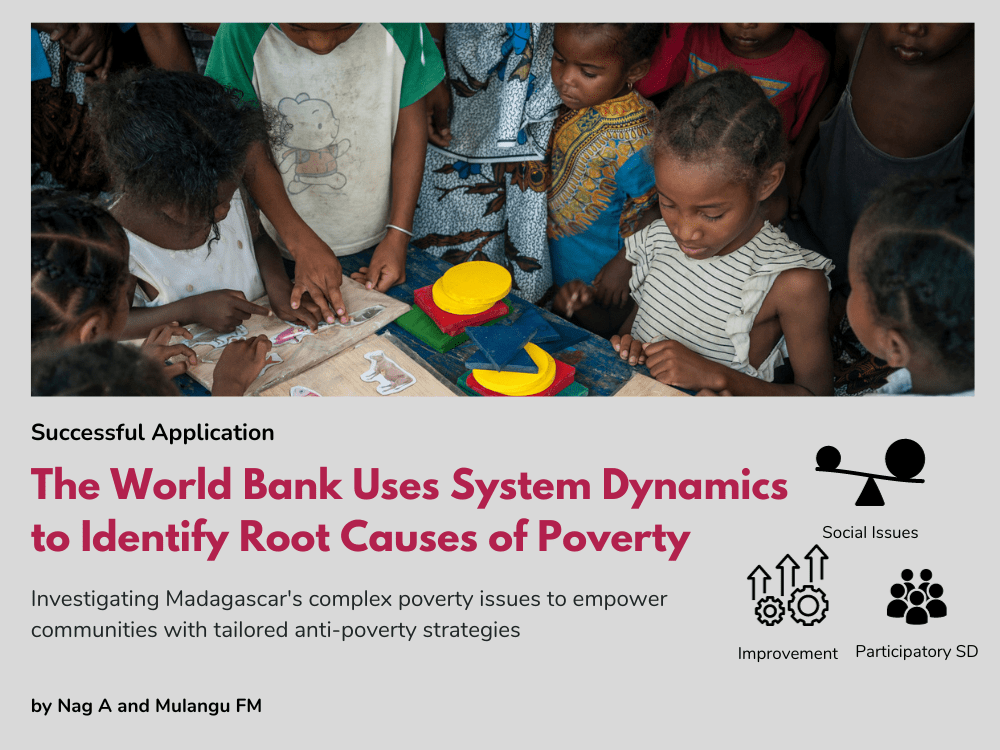
The World Bank Uses System Dynamics to Identify Root Causes of Poverty
EXECUTIVE Summary
-
Madagascar has one of the highest poverty rates in the world. In 2022, an astonishingly three out of every four people in Madagascar lived below the poverty line.
-
Poverty has proven to be particularly resistant to previous policy interventions. Hence, the World Bank decided to turn toward system dynamics to identify the systemic causes of the problem.
-
Working with focus groups across the country, this project developed a causal loop diagram that clearly illustrated vicious cycles that stakeholders see as direct contributors to poverty. It allowed stakeholders to identify potential leverage points to develop anti-poverty programs in Madagascar.
#WorldBank #Poverty #Madagascar
The Problem
Poverty in Madagascar has remained persistently high and somehow complex, despite many attempts to reduce it through anti-poverty policies and interventions. As shown in the Macro Poverty Oulook, the share of the population living in poverty (US$2.15 in 2017 PPP) was 81.7% in 2020, 81% in 2021 and 80.6% in 2022.
One of the reasons why past anti-poverty policies have had less than desired success in reducing poverty is the limited understanding of its determinants. Empirical investigations of the determinants of poverty often use linear specifications that regress objective measures of poverty such as income or consumption against observable indicators theoretically justified to explain poverty.
To uncover the root-causes this analysis used a systems thinking approach to characterize a high-level, dynamic, and multi-dimensional view of the poverty trap with Causal Loop Diagrams (CLD) generated from focus group discussions in 6 provinces across the country.
The Solution
The World Bank organized a series of focus groups across a variety of diverse communities within judiciously selected communes in Madagascar. The aim was to identify, understand, and address the unique poverty challenges they face, and to enrich these findings with qualitative data. These focus groups were intentionally structured to spark discussions about the primary obstacles encountered by the communes. Insights from participants across different ages and genders were used to deconstruct these challenges into several root causes. Each root cause was further distilled into simpler, more comprehensible sub-causes.
The causes and their corresponding sub-causes were reanalyzed after deconstructing the poverty issues faced by each commune. This allowed for diligently examining the intricate interconnections that define these challenges. Special emphasis was given to understanding the interactions among various sub-causes and the overall impact on the system. Specifically, we identified reinforcing patterns or loops that sustain poverty and negate efforts by both individuals and policy interventions to alleviate it. In the end, insights shed light not only into the economic determinants of poverty but also the cultural, political, and behavioral intricacies across different demographics, including gender, age, occupation, and community type (rural/urban).
Analyzing poverty by amplifying the voices of the impoverished and evaluating qualitative data was influenced by a seminal World Bank book titled “Voices of the Poor: Crying out for Change.” This report harnessed focus groups across 23 countries to relay the experiences of the impoverished in their own words. In doing so, it underscored significant multidimensional aspects of well-being that had not been previously explored in conventional poverty analyses.
In addition to highlighting the voices of the impoverished and the crucial subtleties pertaining to their circumstances, this project incorporated systems thinking tools. This innovative approach enabled us to evaluate the qualitative data from the focus groups and discern the pivotal narratives and relationships explaining the perpetual cycle of poverty experienced by many households.

The Causal Loop Diagram is a partial representation of the multi-dimensional poverty trap from the perspective of urban households. The CLD identifies eight feedback loops representing the urban poverty trap that inhibits the group’s ability to:
-
secure high income livelihood opportunities (R1)
-
alleviate impact of cost of living (R2)
-
uplift socio-economic status (R3)
-
participate in decisions (R4)
-
develop resilience to shocks (R5)
-
mitigate increasing cost of business (R6)
-
mitigate shocks to business (R7)
-
enhance skills (R8)
Outcomes
Clearly addressing one or few sub-causes will not generate an overall change required in poverty trap situation. The systems thinking exercise proposes a portfolio of upstream and downstream entry points and pathways to improve the ability of communities to move out of poverty over time. This will inform design of projects by the World Bank to activate the identified entry points.
In particular, the project resulted on a list of potential interventions that are directly linked to the feedback loops driving the system. For example, one of the potential interventions could be to promote business and entrepreneurship. Stakeholders in the focus groups thought that training, mentoring, infrastructure, and financing support could help circumvent the current low levels of business and economic activities (R1), and to diversify employment opportunities (R8).
Do you want to know more?
Connect with Amitaksha Nag, Francis Muamba Mulangu
OTHER SUCCESSFUL APPLICATIONS
System Dynamics Helps Evaluate Anticipatory Action on Cholera Outbreaks
Humanitarian agencies encourage anticipatory action in disaster response to cholera outbreaks in the Democratic Republic of Congo.
Management Design for Planted Forests in Japan Using System Dynamics
Hanno City in Saitama Prefecture used a system dynamics model to enable detailed analysis of labor requirements and changes in forest conditions.
Solving Bottlenecks in Dairy Production Facilities with System Dynamics
FriedslandCampina employed system dynamics to strategically enhance production efficiency in the midst of factory merging.
Upcoming Events
2024 International System Dynamics Conference
The International System Dynamics Conference is coming to Bergen! Save the date: August 4-8, 2024. We hope to see you there! #ISDC2024
Recent Posts
How Did En-ROADS Get 755,000 users? Lessons on Modeling, Interface Design, and Facilitation
This article discusses the En-ROADS climate model, detailing its robust modeling, intuitive interface design, effective facilitation, and strategic policy engagement for global impact.
Society Governance Updates
New System Dynamics Society leadership
Call for Presenters: Seminar Series
Share your insights in the System Dynamics Society Seminar Series. Submit your proposal and join a global community of experts
Join us
OTHER SUCCESSFUL APPLICATIONS
System Dynamics Helps Evaluate Anticipatory Action on Cholera Outbreaks
Humanitarian agencies encourage anticipatory action in disaster response to cholera outbreaks in the Democratic Republic of Congo.
Management Design for Planted Forests in Japan Using System Dynamics
Hanno City in Saitama Prefecture used a system dynamics model to enable detailed analysis of labor requirements and changes in forest conditions.
Solving Bottlenecks in Dairy Production Facilities with System Dynamics
FriedslandCampina employed system dynamics to strategically enhance production efficiency in the midst of factory merging.
Recent Posts
How Did En-ROADS Get 755,000 users? Lessons on Modeling, Interface Design, and Facilitation
This article discusses the En-ROADS climate model, detailing its robust modeling, intuitive interface design, effective facilitation, and strategic policy engagement for global impact.
Society Governance Updates
New System Dynamics Society leadership
Call for Presenters: Seminar Series
Share your insights in the System Dynamics Society Seminar Series. Submit your proposal and join a global community of experts
Upcoming Events
2024 International System Dynamics Conference
The International System Dynamics Conference is coming to Bergen! Save the date: August 4-8, 2024. We hope to see you there! #ISDC2024
Fast-Track Cities Uses System Dynamics to Enhance HIV Care
EXECUTIVE Summary
-
Low levels of viral suppression at 69% for people with HIV make it hard to believe the 95% target level will be achieved by 2030 in St. Louis, USA.
-
As a solution, Fast-Track Cities-STL opted to use group model building means to 1) gain understanding of the fragmented service landscape and 2) to empower the community to address causes of health inequality.
-
The causal loop diagram revealed the importance of community-building for care engagement and created the foundation to build capacity by generating interest and commitment among participants. It also shed light on policies’ unintended consequences leading to service fragmentation and the need for rapid start programs to consider holistic social support for sustained care.
#Fast-Track Cities #HIV #Health #USA
The Problem
Levels of viral suppression at 69% for people living with HIV in St. Louis are far below the targeted goal of 95% required to end the HIV Epidemic in the City of St. Louis, U.S., by 2030.
To increase viral suppression, Fast-Track Cities- St. Louis created a subcommittee dedicated to expand access to rapid initiation of antiretroviral (ART) medication (also called Rapid Start) and to utilize a collaborative governance model to engage in consensus-oriented change. This initiative organized a series of group model building sessions, bringing together diverse stakeholders: those living with HIV, patient advocates, healthcare professionals, researchers, and policymakers. The objective of these sessions was threefold:
1. To identify structural barriers affecting the adoption and accessibility of Rapid Start services in St. Louis.
2. To comprehend the varying perceptions and mental models of providers and clients concerning HIV diagnosis and treatment.
3. To guide a standardized approach for implementing Rapid Start ART across different service providers.
Figure 1 – Behavior-over-time graph displaying the percentage of virally suppressed people receiving ART medication in the St. Louis region according to different outcome perceptions.

The Solution
The landscape of Rapid Start in St. Louis remains intricate. Despite three major healthcare providers rolling out rapid start programs, the data and insights from these initiatives have remained compartmentalized. Recognising this challenge, Fast-Track Cities-STL was compelled by the group model building approach as it offered an opportunity to map both the service provision landscape as well as important factors impacting quality HIV service while building capacity among communities. Fast-Track Cities-STL finds it incredibly important to utilize empowerment approaches to build a more agile, responsive public health HIV response.
Hence, the aim of Fast-Track Cities-STL was to use participatory group model building not only as means to uncover a greater understanding about the system of access to rapid start ART in the St. Louis region, but also to lay the groundwork for a grassroots community led collaborative in HIV care that aims at addressing the root causes of health inequities and outcomes. Fast-track Cities-STL anticipated that an interactive approach like group model building could help generate interest and community commitment in working on the solutions.
The resulting model combined insights from participatory GMB sessions involving those living with HIV in St. Louis, healthcare providers, and advocacy groups. The Causal Loop Diagram (CLD) crafted from this process comprised three reinforcing loops and eight feedback loops. Factors like mistrust, personal agency over health, peer support, and access to pivotal services emerged as the most influential determinants in the model’s behavior.
Figure 2 – The resulting CLD based on the GBM sessions.

Three fundamental feedback loops are highlighted. The “Problem of Delays” is a reinforcing loop where waiting for healthcare coverage causes individuals to lose their sense of control over their health. This diminished sense of control subsequently leads to decreased engagement within care spaces. Essentially, the longer the wait, the less control individuals feel, leading to even lesser engagement in care, creating a reinforcing cycle.
In the “Mistrust” balancing loop, experiences of racism and interpersonal stigma within the care system amplify mistrust. This heightened mistrust deters individuals from engaging with care, particularly in “non-peer-led groups.” As a result, they face a reduced risk of encountering cultural incompetency from providers. This loop underscores a critical insight: individuals who face racism and interpersonal stigma in care settings are more likely to disengage due to these negative experiences, balancing out their exposure to potential further harm.
The “Operation in Silos” balancing loop highlights how navigating care within bureaucratic silos makes individuals feel dehumanized, akin to “feeling like cattle.” This sentiment fosters greater mistrust, leading to decreased engagement in care. The more compartmentalized the care, the more individuals feel like mere numbers, leading to a balancing effect where they trust and engage less with the system.
Outcomes
The tangible outcome of the project was the CLD that participants developed and validated during the participatory group model building sessions. Key insights from the model revealed the importance of community-building opportunities for engagement in care, especially in the uptake of Rapid Start ART. The model also shed light on how some well-intentioned policies inadvertently led to service fragmentation and undermined the autonomy and peer support vital for those living with HIV. Furthermore, the model highlighted that the factors influencing the initiation of medication were intrinsically linked to the continuity of care. In essence, the model underscored the need for rapid start programs to holistically consider the social scaffolding essential for individuals to initiate and sustain care.
As aimed by the project, the Group Model Building approach also provided means to build capacity among communities disproportionately impacted by HIV and leverage their insights for system change. On the one hand, the insights offered by the model pointed out the importance of building community to generate engagement in care—including the uptake of Rapid Start ART. On the other hand, the project stimulated interest among participants and recruited them to continue their engagement with the organization; several individuals expressed a commitment to continue working on the project beyond the exercise.
Regrettably, a major setback led to a leadership vacuum, halting the initiative. Nonetheless, a participating organization has taken the baton, advancing the rapid initiation of ART services.
Do you want to know more?
Connect with Megan Keenan
OTHER SUCCESSFUL APPLICATIONS
System Dynamics Helps Evaluate Anticipatory Action on Cholera Outbreaks
Humanitarian agencies encourage anticipatory action in disaster response to cholera outbreaks in the Democratic Republic of Congo.
Management Design for Planted Forests in Japan Using System Dynamics
Hanno City in Saitama Prefecture used a system dynamics model to enable detailed analysis of labor requirements and changes in forest conditions.
Solving Bottlenecks in Dairy Production Facilities with System Dynamics
FriedslandCampina employed system dynamics to strategically enhance production efficiency in the midst of factory merging.
Upcoming Events
2024 International System Dynamics Conference
The International System Dynamics Conference is coming to Bergen! Save the date: August 4-8, 2024. We hope to see you there! #ISDC2024
Recent Posts
How Did En-ROADS Get 755,000 users? Lessons on Modeling, Interface Design, and Facilitation
This article discusses the En-ROADS climate model, detailing its robust modeling, intuitive interface design, effective facilitation, and strategic policy engagement for global impact.
Society Governance Updates
New System Dynamics Society leadership
Call for Presenters: Seminar Series
Share your insights in the System Dynamics Society Seminar Series. Submit your proposal and join a global community of experts
Join us
OTHER SUCCESSFUL APPLICATIONS
System Dynamics Helps Evaluate Anticipatory Action on Cholera Outbreaks
Humanitarian agencies encourage anticipatory action in disaster response to cholera outbreaks in the Democratic Republic of Congo.
Management Design for Planted Forests in Japan Using System Dynamics
Hanno City in Saitama Prefecture used a system dynamics model to enable detailed analysis of labor requirements and changes in forest conditions.
Solving Bottlenecks in Dairy Production Facilities with System Dynamics
FriedslandCampina employed system dynamics to strategically enhance production efficiency in the midst of factory merging.
Recent Posts
How Did En-ROADS Get 755,000 users? Lessons on Modeling, Interface Design, and Facilitation
This article discusses the En-ROADS climate model, detailing its robust modeling, intuitive interface design, effective facilitation, and strategic policy engagement for global impact.
Society Governance Updates
New System Dynamics Society leadership
Call for Presenters: Seminar Series
Share your insights in the System Dynamics Society Seminar Series. Submit your proposal and join a global community of experts
Upcoming Events
2024 International System Dynamics Conference
The International System Dynamics Conference is coming to Bergen! Save the date: August 4-8, 2024. We hope to see you there! #ISDC2024