ISDC 2021 Highlights: A Peek into the Future of System Dynamics Visualization
ISDC 2021 Highlights: A Peek into the Future of System Dynamics Visualization
The International System Dynamics Conference (ISDC) convenes practitioners who demonstrate what’s new and developing in their fields with System Dynamics. This section of the WiSDom Blog, “Conference Highlights,” asks system dynamicists to spotlight key presentations and innovations presented at the conference. Check it out and let us know what you think!
– Conference Highlights Editorial Team: Saras Chung, Will Glass-Husain, Jack Homer, Sara Metcalf, and Remco Peters with coordination by Christine Tang
This highlight by Billy Schoenberg gives us a peek into the future of System Dynamics data visualization.
I’d like to describe a fascinating Plenary Session I attended on Tuesday of this year’s conference. Entitled “Visual HPC Workflows for the Analysis of System Dynamics Models” (HPC stands for High-Performance Computing), the 30-minute plenary talk was given by Brian Bush and Danny Inman of the US National Renewable Energy Laboratory (NREL).
Here’s the background. Over the past two decades, NREL has developed a series of large System Dynamics models, many of them open source. A big part of the task has been to exercise the models over wide ranges of uncertainty. This means, first, developing technology to run these models on NREL’s HPC supercomputer clusters. Second, it means finding an effective way to visualize an enormous volume of simulation output. To do this visualization, they’ve built a “holodeck”-style room where they and their stakeholders can perform model testing. In addition, this room allows them to “walk through” the data in a 3D fully virtual environment.
Brian and Danny put their innovative system in context by saying that it was inspired by the idea of double-loop learning where learners adjust their own mental models of a problem by playing through and taking part in the system.
One of the biggest challenges they’ve faced is the high dimensional complexity of the models they work with. Their models might have thousands of input variables and parameters affecting dozens of output variables and metrics. The big question they’ve been tackling is “How can a visualization system help stakeholders rapidly explore and confidently understand what it is that these models are saying?”
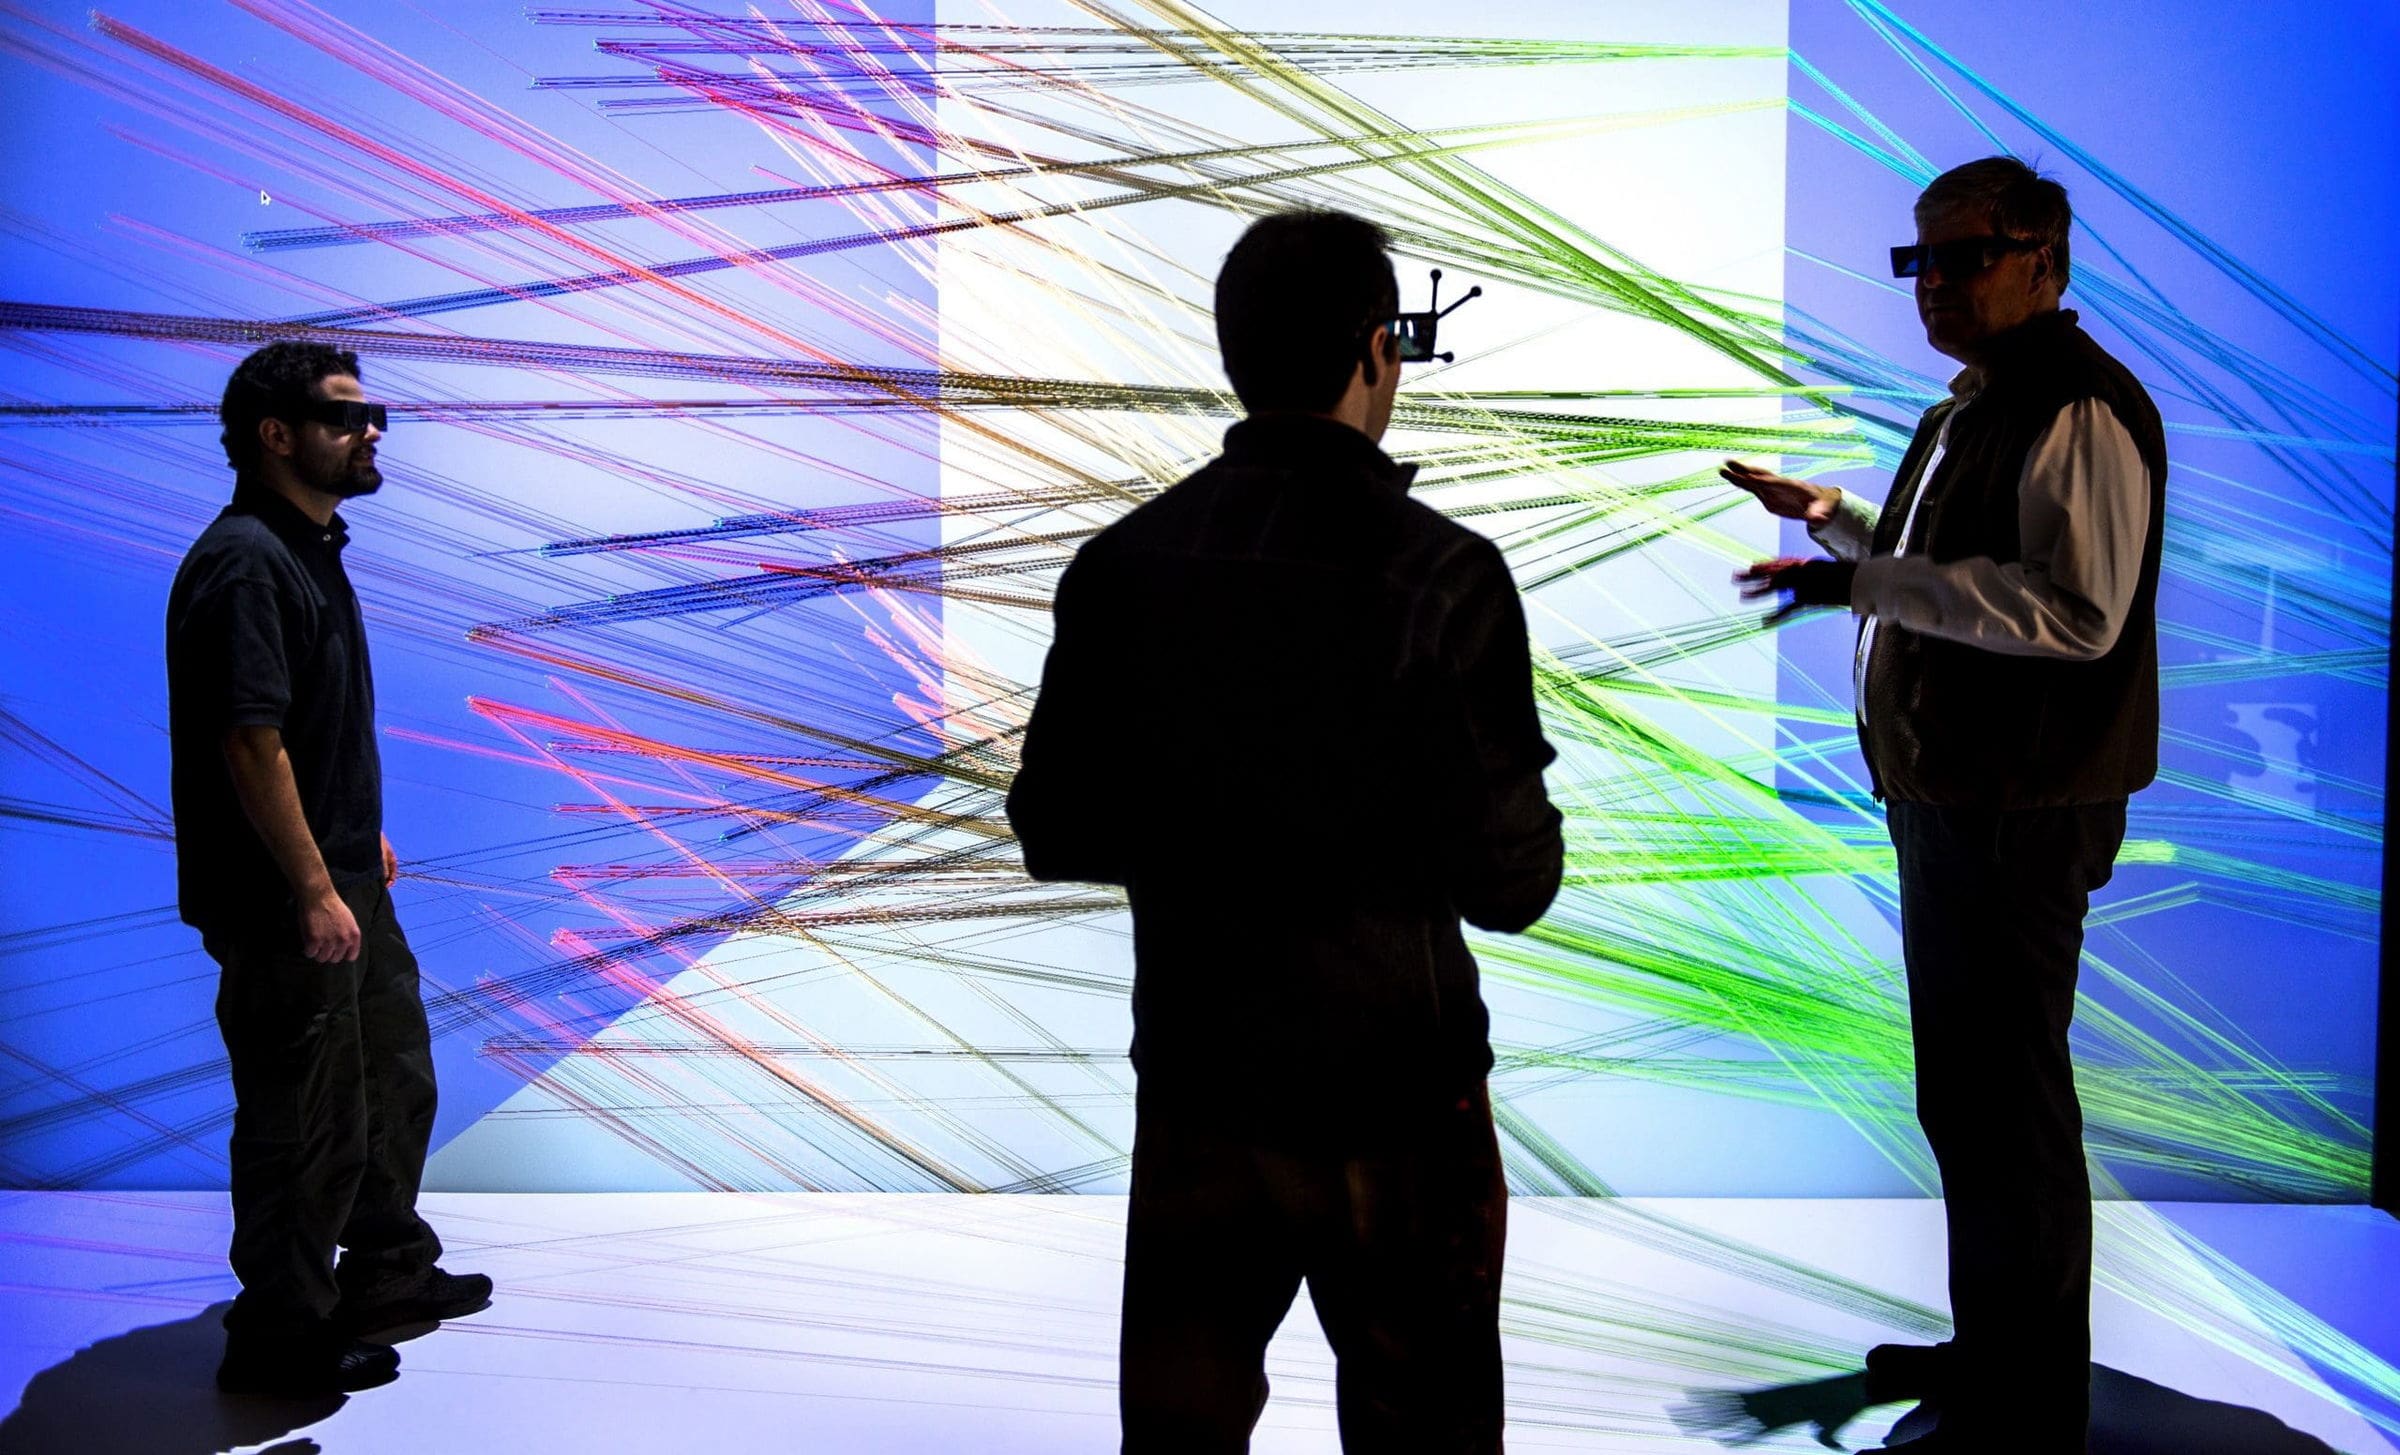
This is where the immersive visualization environments come in. Using these specially equipped virtual-reality rooms, users can reach out and touch the data. You can see what this process looks like in the photo above.
NREL uses this environment to enhance collaboration via “hands-on data processing”, where stakeholders can work together to filter and highlight key dimensions of simulation generated data. This allows them to debug models, design scenarios, identify anomalous results, formulate and test hypotheses, as well as explore the outcomes of a large number of sensitivity runs.
While it’s probably more than just a few years before we all get our own immersive visualization environments, the technology they’ve been developing is gradually trickling down into tools (based on open source software) that can be run on consumer-grade virtual reality or augmented reality headsets.
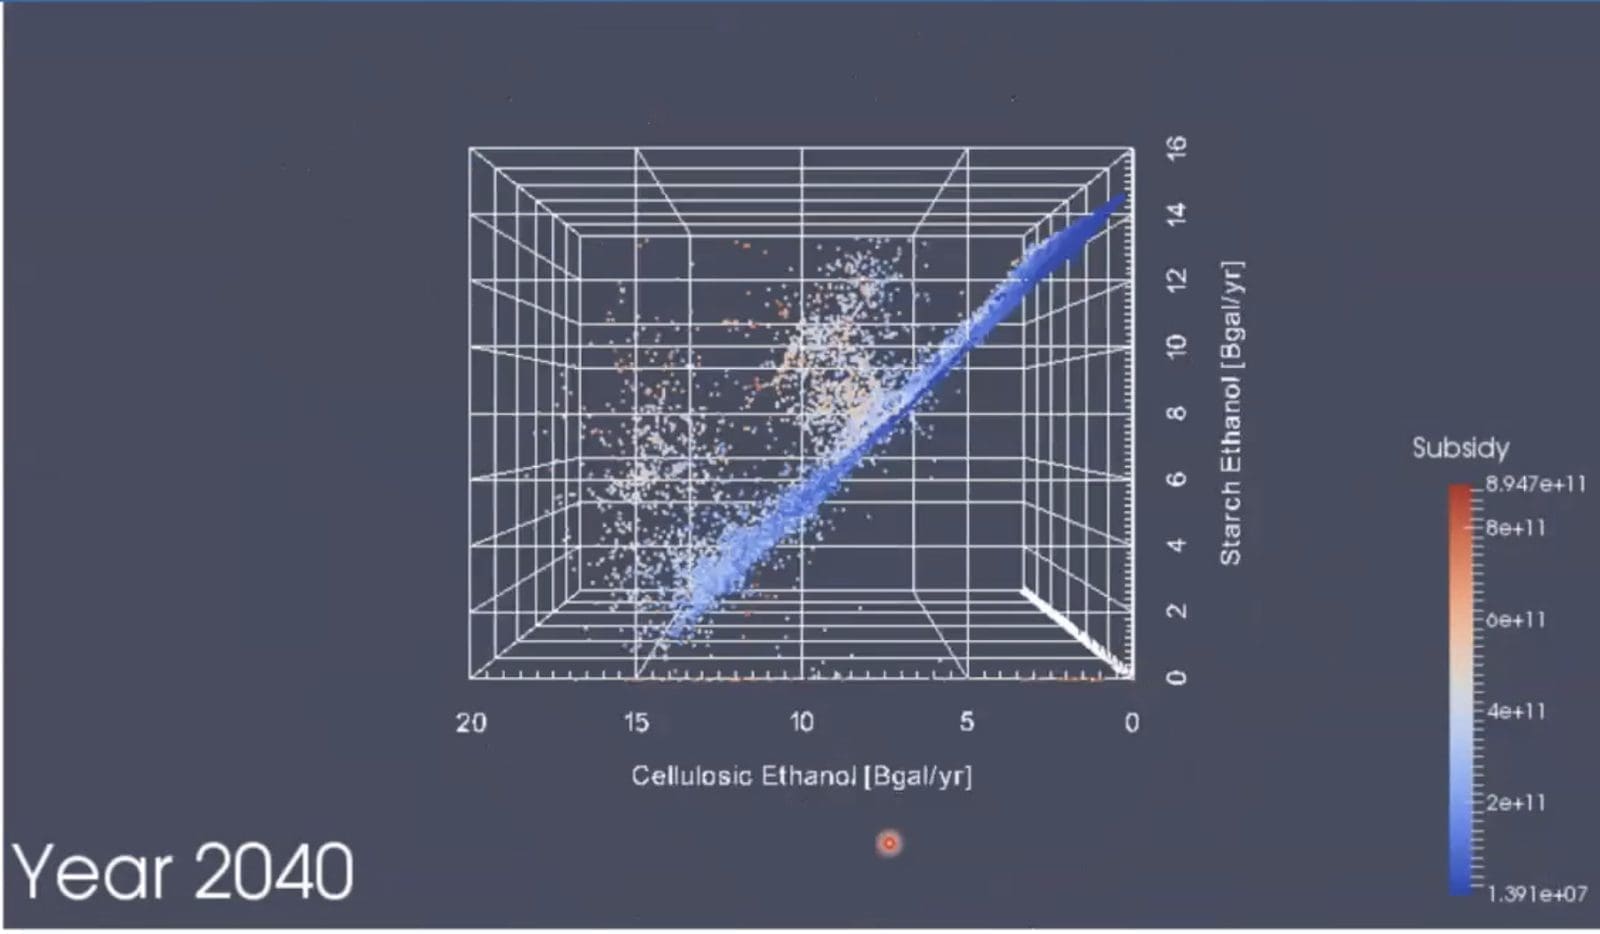
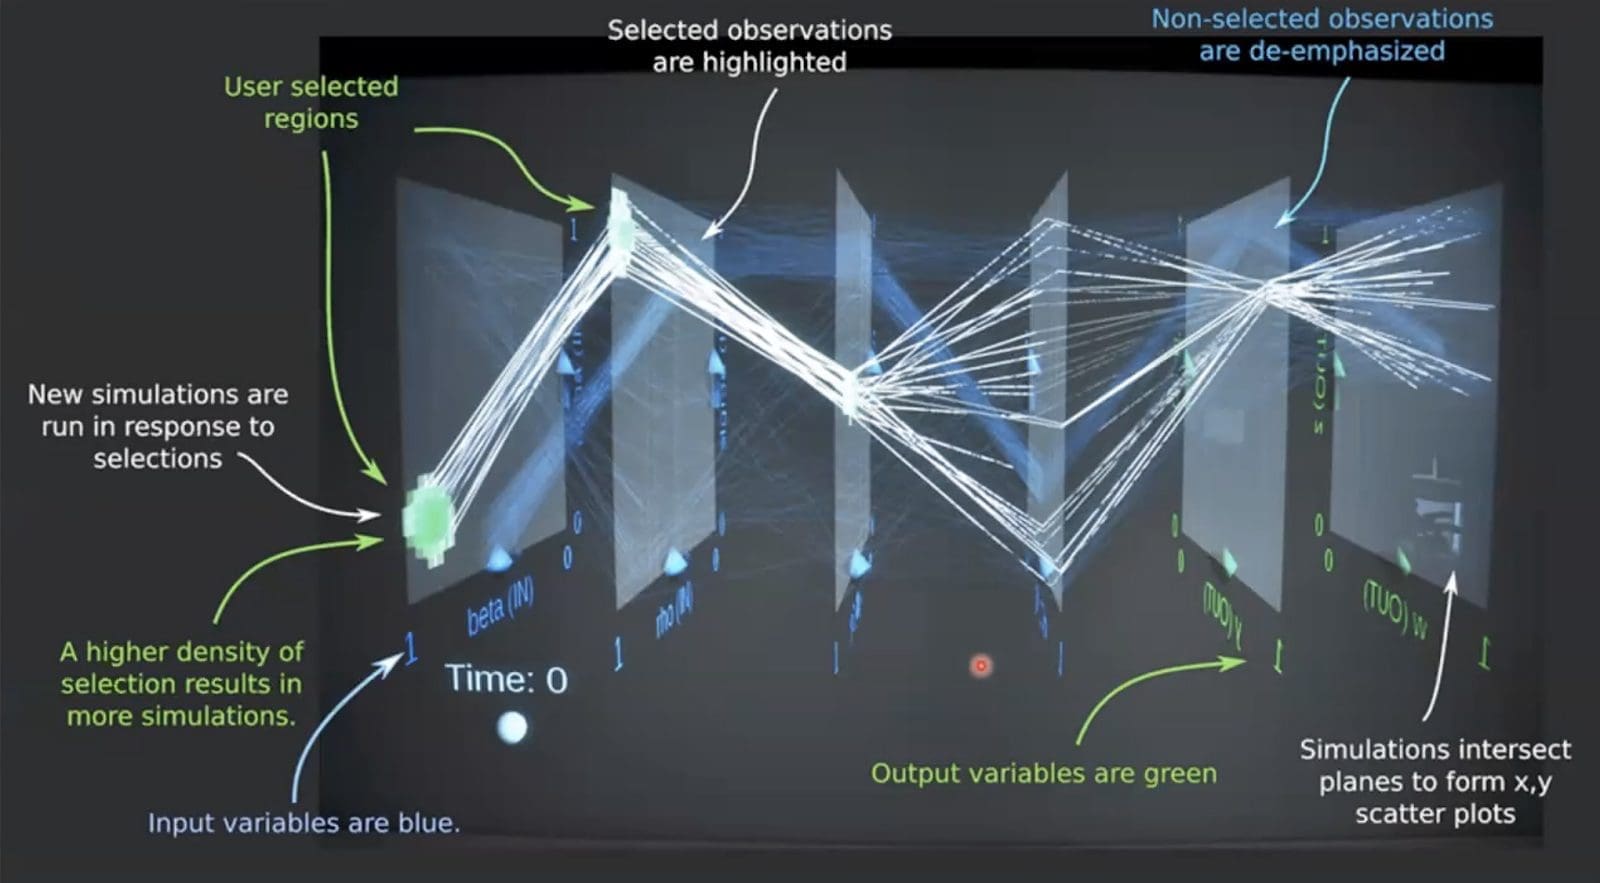
The NREL team has found a few specific types of data visualizations to be particularly effective. These include 3D scatter plots of sensitivity testing results (pictured below); “parallel planes” (pictured below) showing input parameters versus outputs across many runs which are a series of scatter plots where the same observations on each plot are joined by a polyline; and “self-organizing maps” in 2D or 3D space that group together results that are similar according to cluster analysis or other algorithms.
All in all, this was a pretty fantastic look at what the future of System Dynamics model outputs may look like. The immersive visual environments have a retro-futuristic feel, like a Star Trek holodeck brought to life. I doubt that this technology will ever trickle down to ordinary modelers in its full room-based form, though some of the visualization methods (e.g., 3-D scatterplots) are now available and getting some use. What does the future hold? That’s anybody’s guess, but I enjoyed seeing System Dynamics at the forefront of the discussion about how simulation modelers may someday be able to conveniently visualize and make sense of massive amounts of multi-dimensional data.
Billy Schoenberg – billy.schoenberg@iseesystems.com
Recent Posts
How Did En-ROADS Get 755,000 users? Lessons on Modeling, Interface Design, and Facilitation
This article discusses the En-ROADS climate model, detailing its robust modeling, intuitive interface design, effective facilitation, and strategic policy engagement for global impact.
Society Governance Updates
New System Dynamics Society leadership
Call for Presenters: Seminar Series
Share your insights in the System Dynamics Society Seminar Series. Submit your proposal and join a global community of experts
Upcoming Events

2024 International System Dynamics Conference
The International System Dynamics Conference is coming to Bergen! Save the date: August 4-8, 2024. We hope to see you there! #ISDC2024
Recent Business cases
System Dynamics Helps Evaluate Anticipatory Action on Cholera Outbreaks
Humanitarian agencies encourage anticipatory action in disaster response to cholera outbreaks in the Democratic Republic of Congo.
Management Design for Planted Forests in Japan Using System Dynamics
Hanno City in Saitama Prefecture used a system dynamics model to enable detailed analysis of labor requirements and changes in forest conditions.
Solving Bottlenecks in Dairy Production Facilities with System Dynamics
FriedslandCampina employed system dynamics to strategically enhance production efficiency in the midst of factory merging.
Join us
