System Dynamics for Climate Change Mitigation
System Dynamics for Climate Change Mitigation
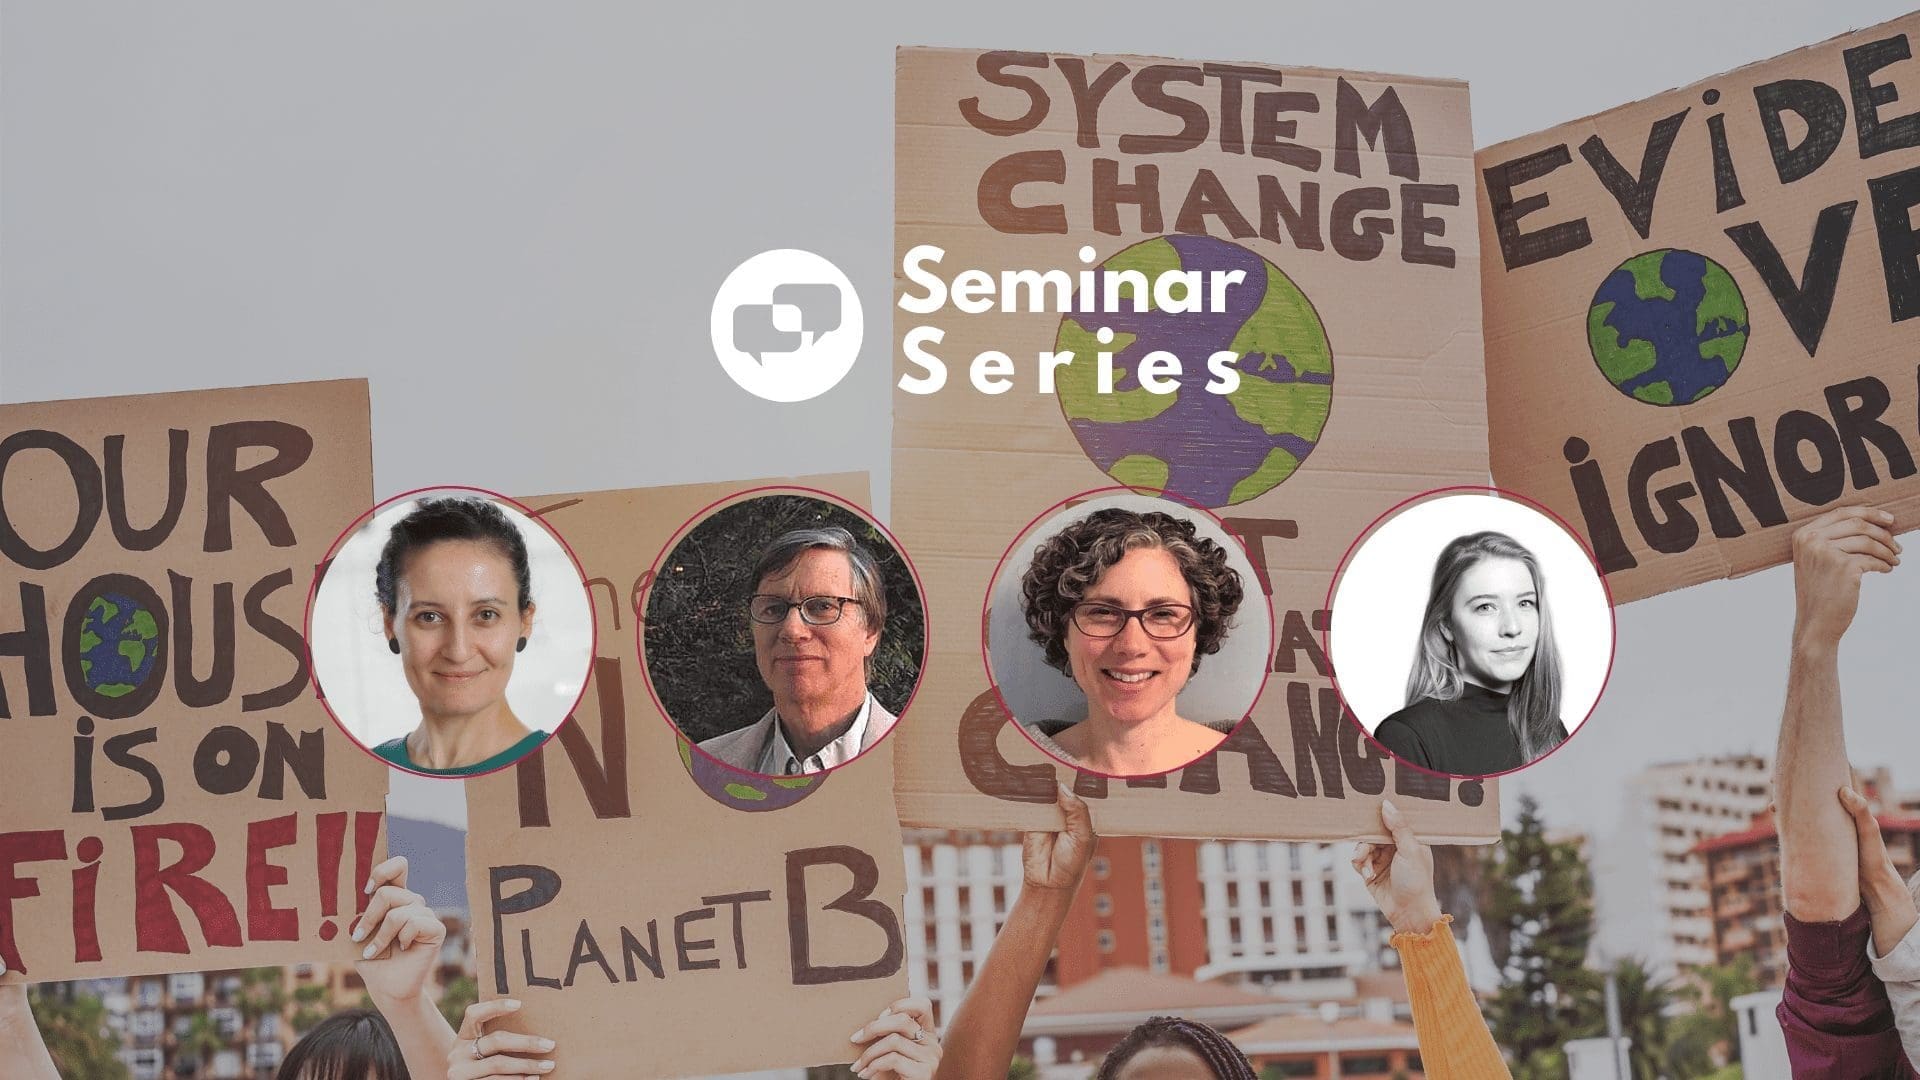
We had an insightful Webinar with the participation of With Juliette Rooney-Varga, Carolyn McCarthy, Sibel Eker, and Steve Arquitt .
Integrated System Dynamics models of economy and environment have long been used for research and decision support for sustainability problems, starting with the seminal work of World Dynamics and Limits to Growth. We discussed how System Dynamics models support decision-making, stakeholder, and public engagement for climate change and sustainability problems. We reflected on existing models and tools, such as Climate Interactive’s En-ROADS and Millennium Institute’s iSDG tool, and their use cases. We also discussed how the Climate Change Initiative at UMass Lowell uses System Dynamics tools to raise awareness on climate change.
If you’re a member, you can watch the webinar recording here.
Below are the answers to questions asked live during the Webinar.
Learn more about the Seminar Series.
Q&A Seminar | System Dynamics for Climate Change
Climate Interactive:
How would you describe the interaction between complex models (GCMs …) and simpler system dynamic models in more detail? (how can they support each other?)
Shortly, large detailed models help for cross-validating the simpler models. In return, simple models support the complex models in stakeholder engagement and scenario co-production.
What are the similarities between the EN-Roads Model & the iSDG Model? What are the main differences?
Both EN-Roads and iSDG are based on the System Dynamics method. Both emphasize transparancy, user friendliness, and shared learning. Both place great emphasis on facilitation and support in shared learning. The differences: EN-Roads is a global model, where iSDG is customized to support planning in a particular country or geographic region. EN-Roads is focused on strategies to keep global temperature below a specified level, where iSDG’s focus is more diffuse taking on all the SDGs.
What are some of the major impacts that the Climate Interactive team see on the application side of the models?
This question was not clear to me during the webinar. If “application” means the use of Climate Interactive’s models, we see quite a substantial impact. Only En-ROADS has been used in 73 different countries so far, engaging almost 63000 people. We have a wide audience, from policymakers and philantropists to higher education students and community members. One of the most striking and uplifting recent examples of En-ROADS outreach is the events organized by one of our ambassadors with smallholder farmers in Tanzania.
Why don’t you use python as the intermediate language? Thanks
Answered during the webinar. Python is a user-friendly language but not as fast as C. We need speed in interactive simulators, so the Vensim model is converted to C.
Are system dynamics models being used in conjunction with Big data and AI?Can system dynamics models learn with machine learning?
There are initiatives about this as far as I know, and ML is very useful for quantifying empirical relationships, but outsourcing the model building completely to AI is not possible, neither desirable in my opinion. System Dynamics’s main strength lies in its descriptive nature, accessibility and understandability. While a hard coupling of SD and machine learning can provide many benefits, it might override the main strengths.
Since there seems to be many questions/comments regarding implementation/compliance, might it be helpful to start focusing on modeling the topic of governance itself, in order to identify and understand the influencing dynamics and loops on the gaps between the ideal solutions actually implemented?
In general, especially regarding specific sustainability governance problems, I agree that this should be the approach, because problem delineation and understanding the system strructure is key to developing any solution. In En-ROADS, though, the primary purpose is public engagement around the topic of “solutions”, hence the underlying dynamics are not co-modelled but shared with the users through various indicators and graphs.
Does the Climate Interactive climate-economy feedback have anything to do with Nordhaus’ “damage” function?
Since En-ROADS is an interactive simulator, it includes a damage function that allows the users to experiment with various “damage functions” found in the literature, including Nordhaus, or make their own assumptions. You can read more about it here
When will the nature-based/land-based parts in En-ROADS be accessible online?
In the next few months. Please check either the En-ROADS simulator or this page
Very interesting presentation Sibel. Can SDeverywhere and the implementation into a website be done by somebody completely unfamiliar with C or Java or any programming? Many thanks.
I must say that it would be a bit challenging for someone who has no programming experience. There are guidelines, though, which might be helpful to get started.
Questions to Millennium Institute
What are the similarities between the EN-Roads Model & the iSDG Model? What are the main differences?
Both EN-Roads and iSDG are based on the System Dynamics method. Both emphasize transparancy, user friendliness, and shared learning. Both place great emphasis on facilitation and support in shared learning. The differences: EN-Roads is a global model, where iSDG is customized to support planning in a particular country or geographic region. EN-Roads is focused on strategies to keep global temperature below a specified level, where iSDG’s focus is more diffuse taking on all the SDGs.
Are parts of iSDG Model publically available?
Yes, go to www.millennium-institute.org/isdg . There you can access a demonstration model, videos on the iSDG, and the model documentation.
To what extent is the Millennium Institute SDG model open source? It would be so nice to use it rather than starting modelling from scratch in every research project.
At this time the iSDG is not open source. iSDG models are developed within the frame of a specific project. However, much can be learned about the model and its structure by visiting www.millennium-institute.org/isdg.
@Steve, how do you integrate “indicators” of SDG’s to report a single metric?
The iSDG reports the status of each of the 17 SGDs separately. The level of performance of the targets falling under each SDG are averaged to calculate the SDG performance. Targets can be thought of as desired levels of indicators. For a complete explanation see https://www.pnas.org/content/pnas/suppl/2019/10/29/1817276116.DCSupplemental/pnas.1817276116.sapp.pdf
SDG and how it is implemented in real world is highly context-dependence – how iSDG address this?
The iSDG is customized for the country or regional setting. Workshops are held with local experts, decision-makers, and stakeholders who review the model and identify key issues and policies to include inthe iSDG model.
Steve’s question regarding connecting real action to the plan is important. How do we make the interactive modeling tools an integral part of follow up and feedback on action?
With climate change and the SDGs both this really hits the crux of the matter. With the iSDG it is important to involve a broad spectrum of stakeholders on the modeling team and in the workshops who are motivated to see that the selected scenarios are being transformed into policies and then funded. This will require a well-trained team that can run scenarios, derive policies and work with the relevant government people to assure implementation. Monitoring is essential, and needs to be built into the projects. I fully agree with Juliette that the models need to engage with citizens who will then push leaders to make the necessary changes. I would love to hear others’ ideas and experiences on this.
Why choose poverty as a key #1 SDG?
“No poverty” as SDG1 was defined and designated by agreement of the 193 Agenda 2030 signatory countries. There is debate about which SDG is the most important. The iSDG takes no position on which SDG is the most important However, in the iSDG poverty is linked to almost every SDG.
Is this model (MI iSDG Tool) built in STELLA?
If you mean the iSDG, yes the model I showed was built in STELLA however we also have a version in Vensim.
What are some of the active projects that MI is doing today?
Currently we are working on iSDG projects in Afghanistan, Bhutan, China, Uganda, Namibia, Djibouti, Kenya, Democratic Republic of the Congo.
This question–or 2 questions–are for Steve. First, are worldviews and values included in the iSDG models? If so, how? A second question relates to how the highest-level decision-makers regard the models. I’m new to SDS but spent a number of years working with a roughly analogous set of high-level
After some relection, worldviews and values are pervasive in the iSDG model by virtue of the SDGs themselves. iSDG is intended to help policy-makers design strategies and allocate resources for attaining the SDGs. This includes the “leave no one behind” principle, gender equity in education and economic opportunities, equitable income distribution, preserving biodiversity for future generations, rule of law and many others.
Questions to CCI
@CCI any tips on how to engage kids with these tools?
Find resources: Comprehensive Facilitator Resources Online World Climate Resources
Steve’s question regarding connecting real action to the plan is important. How do we make the interactive modeling tools an integral part of follow up and feedback on action?
Watch the recording for a full answer
@Juliette, could you say a bit about hope? There is a political divide especially in the US, but I read recently that % of the US population who feels anxious about climate change is ~68%. Could role-play games help deal with this anxiety?
Watch the recording for a full answer
“Research shows that showing people research doesn’t work”. What are your thoughts on this @Juliette?
We agree with John Sterman! But if you want to read more about this research, you can here
Why do you think that higher levels of “hope” begin and end higher with the i-H group?
Watch the recording for a full answer
Was the ethnic cultural diversity in your simulation group meetings more diverse than the photos would suggest? If not it’s concerning that you have a rather restricted sample?
Thank you for this question. The breakdown of participants’ racial and ethnic diversity for Building Consensus for Ambitious Climate Action through the World Climate Simulation can be found on page seven. Limitations relevant to our sample can be found on page 24 and reads, “Our sample was not randomly drawn from the general population and is therefore not expected to be representative of the American public. In addition, because the youngest participants in our study were drawn from programs serving low-income, first-generation-to-college students, age likely correlates with other demographic traits in our sample. We therefore do not claim that the observed effects of the simulation or demographics extend to the general American population.”
Recent Posts
Consideo’s Insight into the Global Energy Transition: A Systems Perspective
Consideo’s Insight into the Global Energy Transition: A Systems Perspective Complexities of Energy TransitionThe global energy transition is a complex challenge. The development of technology, the need for resources, the depletion of high-grade materials and...
A Digital Twin Business Model in 40 Hours
A Digital Twin Business Model in 40 Hours Though long past the date when I should have ‘retired’, I just can’t resist interesting projects, like the one a new friend brought me a few weeks ago. It concerns a small but fast-growing B2B business,...
2023 PwC Mark Paich Hackathon Highlights
2023 PwC Mark Paich Hackathon Highlights The System Dynamics Society and PwC US joined forces to hold a hackathon event that brought together practitioners, researchers, and students passionate about the System Dynamics methodology. The 2023 PwC Mark Paich Hackathon...
Upcoming Events
From Text to Map: A System Dynamics Bot for Constructing Causal Loop Diagrams
May, 15 at 11 am NY | 4 pm London | 11 pm Beijing | Time Converter From Text to Map: A System Dynamics Bot for Constructing Causal Loop Diagrams Join us to delve into the innovative System Dynamics Bot, a tool designed to automate causal loop diagram creation from...
Recent Business cases
Fast-Track Cities Uses System Dynamics to Enhance HIV Care
Fast-Track Cities Uses System Dynamics to Enhance HIV Care EXECUTIVE Summary Low levels of viral suppression at 69% for people with HIV make it hard to believe the 95% target level will be achieved by 2030 in St. Louis, USA. As a solution, Fast-Track Cities-STL opted...
System Dynamics Unravels ICU Tensions at the Portuguese Oncology Institute
System Dynamics Unravels ICU Tensions at the Portuguese Oncology Institute EXECUTIVE Summary The Portuguese Oncology Institute (IPO) faced a critical challenge in its intensive care unit (ICU) where doctors and nurses experienced high turnover due to tensions with...
System Dynamics Helps Farmers Escape Poverty Trap in Guatemala
System Dynamics Helps Farmers Escape Poverty Trap in Guatemala EXECUTIVE Summary Guatemala holds the 4th highest global ranking for chronic malnutrition, and climate change is intensifying the challenges subsistence farmers face in providing food for their families....
Join us

Watch the recording below
Practitioner Profile: Matteo Pedercini, Millennium Institute

Practitioner Profile: Matteo Pedercini, Millennium Institute
Welcome to Practitioner Profiles, a series of up-close blog-length interviews with experienced System Dynamics practitioners. We have a standard set of 10 questions and let practitioners take the responses in any direction they choose. They tell us about who they are, how they got involved with the field, how they work with clients, and in what new directions they may be heading. A new profile will be posted every few weeks during 2021.
For any questions or comments, please contact the editors of these interviews, Dr. Jack Homer (jack@homerconsulting.com) and Dr. Saras Chung (saras@skipdesigned.com).
For today’s spotlight, we talked with Matteo Pedercini from the Millennium Institute.

lWhat kinds of SD project applications does Millennium Institute do?
We develop integrated simulation models for national planning, with the purpose of providing national governments with the tools and capacity to create sustainable development strategies.
What is distinctive in your approach to SD projects?
I can think of two ways our approach is distinctive. First, our primary goal is to provide tools and capacity, so that our client-partners can eventually perform the required analysis themselves. Second, most of our modeling starts from a “template” that accumulates the learning from each country project into an ever-enriching framework.
In what way is MI perhaps different from other organizations doing SD project work?
I think we are an especially open organization, with a flat network structure, that allows all of us to express our ideas and learn from one another.
What is your role at MI?
I supervise our project work and facilitate knowledge exchange within the organization.
How did you originally get interested in SD, and when was that?
My first exposure to SD goes back to the mid-nineties, when I first played the Beer Game and did some very preliminary modeling at undergraduate level. I got so passionate about it that I started looking for self-instruction materials—for example, Road Maps—reading avidly anything I could find. The Fifth Discipline was also influential for me. At the time, I was working for an NGO in Central Africa, and the systems perspective that I was slowly building was proving to be a tremendously effective framework for understanding the issues I was trying to address.
What individuals or organizations are inspirations to you?
I was, and continue to be, inspired by the work of the SD group at the University of Bergen, my alma mater. Besides their research and teaching, what really struck me is how Pål Davidsen and Erling Moxnes embedded that systems perspective and principles in their everyday work, leading the group by example.
What accomplishments are you proud of?
I am happy to see that SD modeling is gradually coming out of the shadows and is increasingly used for sustainable development planning. It is still not a mainstream method, but systems perspectives seem to be gaining broader recognition and acceptance. This acceptance is necessary for the world to adopt a deep understanding of the sustainability issues we face and the changes that need to be made. I believe MI has contributed to such positive change, and I am proud of that.
What challenges have you experienced?
The single most difficult challenge that we have faced in many projects is the high turnover of key personnel in our client-partner institutions. Training is a central component of our approach and is critical for proper institutionalization. High turnover can undermine our attempts to establish a solid core of well-trained personnel.
What kinds of SD work would you like to be doing over the next 5 years?
I’d like to further explore hybrid modeling methods, in particular blending SD with dynamic stochastic general equilibrium modeling, to strengthen our economic formulations, and agent-based modeling, to bring granularity and network dynamics where needed. I have seen such hybrid modeling attempted, but there is plenty of room for improvement in its coherence and transparency.
Are there any specific changes you would like to make in your approach to SD projects?
It is sometimes hard to balance project efficiency and client-partner involvement. Our approach emphasizes such involvement, but we often experience delays trying to adjust the project timeline to the client-partner’s availability. When coupled with the problem I mentioned of client-partner personnel turnover, the delays can lead to a lot of rework. I’d like to be able to increase efficiency without giving up on client involvement, which in the long run is critical for institutionalization.
Have other questions or comments? Leave a comment below or learn more about Matteo Pedercini’s work here.
Recent Posts
From Bergen to Global: UiB’s System Dynamics Group
From Bergen to Global: UiB’s System Dynamics Group The System Dynamics Group, an autonomous research group at the University of Bergen (UiB) was established in 1971 by professor emeritus Svein Nordbotten. Inspired by the work of Jay W. Forrester, Nordbotten...
Consideo’s Insight into the Global Energy Transition: A Systems Perspective
Consideo’s Insight into the Global Energy Transition: A Systems Perspective Complexities of Energy TransitionThe global energy transition is a complex challenge. The development of technology, the need for resources, the depletion of high-grade materials and...
A Digital Twin Business Model in 40 Hours
A Digital Twin Business Model in 40 Hours Though long past the date when I should have ‘retired’, I just can’t resist interesting projects, like the one a new friend brought me a few weeks ago. It concerns a small but fast-growing B2B business,...
Upcoming Events
From Text to Map: A System Dynamics Bot for Constructing Causal Loop Diagrams
May, 15 at 11 am NY | 4 pm London | 11 pm Beijing | Time Converter From Text to Map: A System Dynamics Bot for Constructing Causal Loop Diagrams Join us to delve into the innovative System Dynamics Bot, a tool designed to automate causal loop diagram creation from...
Recent Business cases
Fast-Track Cities Uses System Dynamics to Enhance HIV Care
Fast-Track Cities Uses System Dynamics to Enhance HIV Care EXECUTIVE Summary Low levels of viral suppression at 69% for people with HIV make it hard to believe the 95% target level will be achieved by 2030 in St. Louis, USA. As a solution, Fast-Track Cities-STL opted...
System Dynamics Unravels ICU Tensions at the Portuguese Oncology Institute
System Dynamics Unravels ICU Tensions at the Portuguese Oncology Institute EXECUTIVE Summary The Portuguese Oncology Institute (IPO) faced a critical challenge in its intensive care unit (ICU) where doctors and nurses experienced high turnover due to tensions with...
System Dynamics Helps Farmers Escape Poverty Trap in Guatemala
System Dynamics Helps Farmers Escape Poverty Trap in Guatemala EXECUTIVE Summary Guatemala holds the 4th highest global ranking for chronic malnutrition, and climate change is intensifying the challenges subsistence farmers face in providing food for their families....
Join us
Top 10 Tips to Engage People with a System Dynamics Model
Top 10 Tips to Engage People with a System Dynamics Model
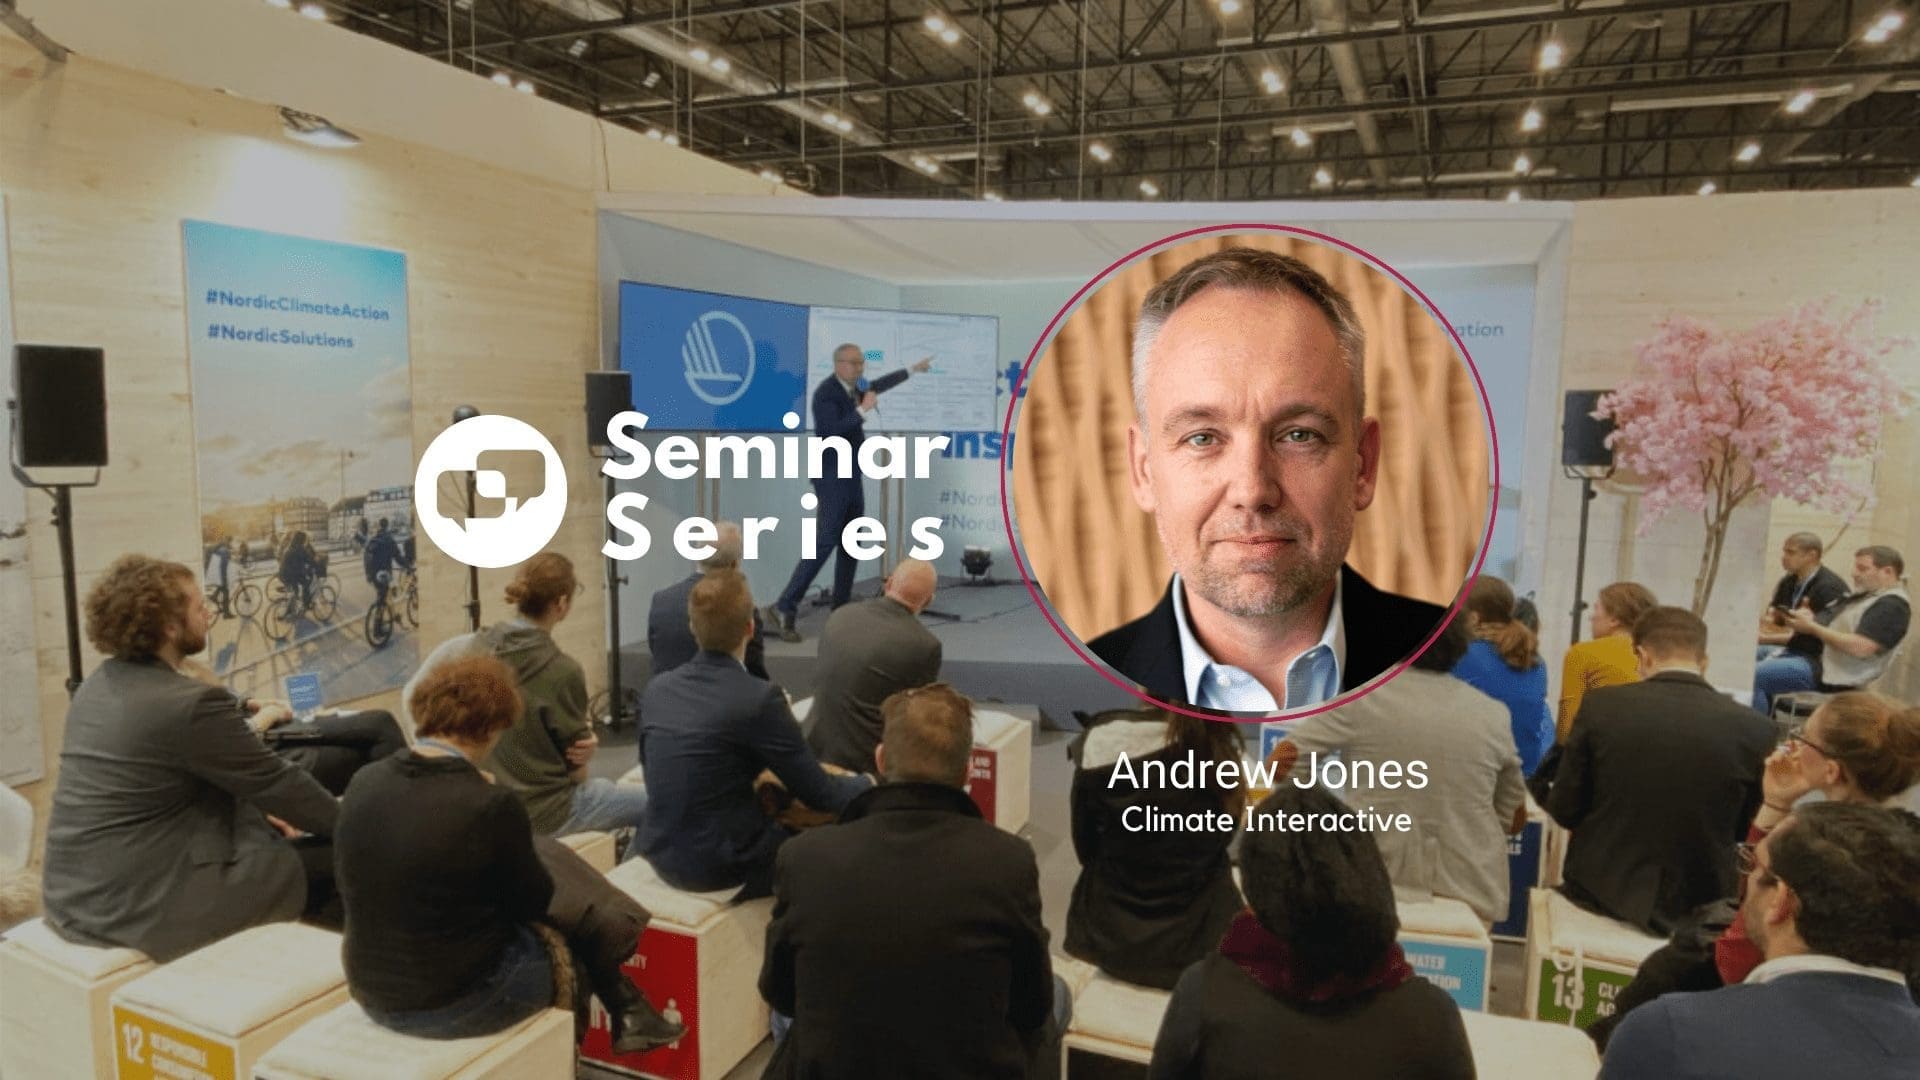
Andrew P. Jones is Co-Founder and Co-Director of Climate Interactive and a Research Affiliate at MIT Sloan. Andrew is an expert on climate change and energy issues, a prominent System Dynamics modeler, and a keynote speaker.
In his webinar with System Dynamics Society, Jones presented his 10+1 tips to engage people with a System Dynamics model. Here’s a summary of the tips, but you can watch the recording below for all details!
All Seminar Series are free for members of the Society. Join us today and unlock all benefits!

1. Make it a challenging adventure on their terms in your virtual world
Make your model playful to entice curiosity about what it tests. This is a virtual world where people will experience something new. The challenging adventure or game is what we do mostly with the interface of the model. If you open the En-ROADS interface, you will see two main graphs, the main output, and several sliders. When playing with the sliders, your changes will be reflected in the graphs. Avoid telling people: “I’m going to show you how to do this”, instead, try saying: “On your terms, you’re going to have to figure out how to get that graph down to your target line”
“We do NOT model systems. We model problems.
2. Focus on mental models you want to improve
We do NOT model systems. We model problems. In System Dynamics, we define a problem as a behavior over time, a reference mode that we’re curious about why does it behave like that. We’re so curious about the problem that we develop a simulation to understand it. We build interfaces to improve the mental models of the stakeholders or clients. System Dynamics modelers know that mostly the mental models of decision-makers don’t match with the real world and how the actual system behaves. We don’t build interfaces to give access to policy levers in the system, but we are trying to leverage the necessary mental model improvements.
3. Make participants mentally simulate before running a scenario
If people don’t have a theory, they don’t notice the mental model they use to forecast what’s going to happen. Then they don’t get to learn and improve their understanding. Therefore, you must encourage people to anticipate, based on their own theories, what’s going to happen when running a scenario. No theory, no learning.” (Edward Deming)
“Tell people what to look at, let them guess what they are going to see, and then make it exciting like a movie”
4. Create a dynamic visual experience
Humans like to see change and it is important to employ this fact to get people to run and look at your graphs without losing their focus. Make people think and anticipate and then direct their eyes to what you want them to notice. If you do this well, you don’t even need to draw a Causal Loop Diagram because they are drawing it in their heads. Tell people what to look at, let them guess what they are going to see, and then make it exciting like a movie.
5. Set up participants to talk with each other
People learn socially and with hot-button issues like climate change, they need to know that their friends are not going to hate them if they change their minds. You need people to be processing the information collectively and socially with others. When presenting your model, stop frequently and advise: “Turn to the person next to you and discuss what you think of that conclusion”.
“Keep the discussion on improving system performance not on the tool you’re using”
6. Know along the way that you are playing at least seven roles
Try to present your model with the help of, at least, another person. Ideally, you need someone to facilitate the discussion while another runs the model. As a facilitator, you will be playing four roles including:
Coach – Helping participants to extract insights out of the model.
Professor – Teaching the audience theories and sharing factual information
Playwright – Creating an emotional journey of ups and downs.
Fellow Traveler – Being authentic, vulnerable, and just another person trying to solve a complex problem. If it is worth making a model about, it’s very important. If it is very important, you must deeply care about it.
You want the conversation to be around how to solve a complex problem together and what your audience is going to do about it. Keep the discussion on improving system performance not on “oh that’s a cool model how did you make that”. That’s all side information.
You want to minimize your roles in:
Tech – you must keep the conversation on improving the system performance, not the way or tool you have used to develop the model or create the graphs
Advocate – when people disagree with you, your job is not to fight them or disagree with them back, but to set up others to find the voice of your work.
Defender – Don’t get involved in the fight of “YOU HAVE A BAD MODEL!”. Avoid this fight as much as you can.
Read the article “Teamwork in Group Model Building” on the System Dynamics Review for more insights on strategies for efficient and effective model building in groups.
7. Build confidence and share testing as needed
You can share your tests and comparisons to other models and/or predictions to build stronger confidence. For instance, Climate Interactive and MIT Sloan built the En-ROADS with the best science available, using the data sources such as the Intergovernmental Panel on Climate Change (IPCC) and International Energy Agency. All the assumptions are available open-source in the 400-page reference guide. Many of the assumptions that someone might not believe in are changeable within the model. Several models do not have good literature of other scenarios to compare against, while En-ROADS can be compared with six integrated assessment models to build confidence.
8. Use loops and stock/flow diagrams only to illuminate
As you help people improve their intuition, sometimes you need to use loops and stock/flow diagrams, especially if you are presenting to a more technical audience but always connect it to the simulator. Avoid showing this to policymakers, they are usually not interested in the loops, instead, tell a story about reinforcing or balancing feedback.
9. Make space for feelings and processing
Deliver your presentation with excitement and intensity, but you need to slam on the brakes and let participants compromise with their feelings and do the necessary processing. You may create a scenario of success, and they get to create their vision, something that they would love to see. And it’s time to slam on the brakes and may invite them to 60 seconds of silence. Yes! It is weird but imagine 60 seconds of silence of people sitting with a scenario of success.
“Create the conditions where people are open to changing their minds”
10. Pay attention to three legs of the learning stool
Reflective Conversation – Create the conditions where people are open to changing their minds, surfacing and testing assumptions, and talking to their peers about improving their assumptions. You’ve got to make the space where people are open to being wrong and thinking differently.
Vision – Help people see a future that they fall in love with they just want it so badly that they see the gap between the vision they want and the reality that they feel and experience that tension in between. Orient towards what one genuinely cares about.
Systems Thinking – Explaining how a complex system works where time, cause, and effect are distant in time and space can be difficult, especially when you include stocks, flows, feedback loops, and other inner relationships. You can learn how to facilitate a training that uses systems thinking and System Dynamics for free with Climate Interactive learning resources
10 + 1. Give them the simulator
People need your help as a facilitator, but you must give them something to play with that naturally gives them the mental model improvements that you want and guides them towards committing themselves to action to improve system performance. As Buckminster Fuller states “If you want to teach people a new way of thinking, don’t bother trying to teach them. Instead, give them a tool, the use of which will lead to new ways of thinking.”
Watch the recording below
Recent Posts
Consideo’s Insight into the Global Energy Transition: A Systems Perspective
Consideo’s Insight into the Global Energy Transition: A Systems Perspective Complexities of Energy TransitionThe global energy transition is a complex challenge. The development of technology, the need for resources, the depletion of high-grade materials and...
A Digital Twin Business Model in 40 Hours
A Digital Twin Business Model in 40 Hours Though long past the date when I should have ‘retired’, I just can’t resist interesting projects, like the one a new friend brought me a few weeks ago. It concerns a small but fast-growing B2B business,...
2023 PwC Mark Paich Hackathon Highlights
2023 PwC Mark Paich Hackathon Highlights The System Dynamics Society and PwC US joined forces to hold a hackathon event that brought together practitioners, researchers, and students passionate about the System Dynamics methodology. The 2023 PwC Mark Paich Hackathon...
Upcoming Events
MINDS Cast Ep. 5 – Expanding System Dynamics with Hybrid Modeling w/ Scott Fortmann
This talk discusses extensions to System Dynamics modeling to integrate other modeling methods, notably Agent-Based Modeling. We will explore techniques for Agent-Based Modeling and how to integrate them into System Dynamics models; we will see how to extend...
Recent Business cases
Fast-Track Cities Uses System Dynamics to Enhance HIV Care
Fast-Track Cities Uses System Dynamics to Enhance HIV Care EXECUTIVE Summary Low levels of viral suppression at 69% for people with HIV make it hard to believe the 95% target level will be achieved by 2030 in St. Louis, USA. As a solution, Fast-Track Cities-STL opted...
System Dynamics Unravels ICU Tensions at the Portuguese Oncology Institute
System Dynamics Unravels ICU Tensions at the Portuguese Oncology Institute EXECUTIVE Summary The Portuguese Oncology Institute (IPO) faced a critical challenge in its intensive care unit (ICU) where doctors and nurses experienced high turnover due to tensions with...
System Dynamics Helps Farmers Escape Poverty Trap in Guatemala
System Dynamics Helps Farmers Escape Poverty Trap in Guatemala EXECUTIVE Summary Guatemala holds the 4th highest global ranking for chronic malnutrition, and climate change is intensifying the challenges subsistence farmers face in providing food for their families....
Join us
Practitioner Profile: Drew Jones, Climate Interactive

Practitioner Profile: Drew Jones, Climate Interactive
Welcome to Practitioner Profiles, a series of up-close blog-length interviews with experienced System Dynamics practitioners. We have a standard set of 10 questions and let practitioners take the responses in any direction they choose. They tell us about who they are, how they got involved with the field, how they work with clients, and in what new directions they may be heading. A new profile will be posted every few weeks during 2021.
For any questions or comments, please contact the editors of these interviews, Dr. Jack Homer (jack@homerconsulting.com) and Dr. Saras Chung (saras@skipdesigned.com).
For today’s spotlight, we talked with Drew Jones, Co-Director of Climate Interactive.

What kinds of System Dynamics work does Climate Interactive do?
We developed the C-ROADS and En-ROADS simulation models with our partners at MIT and Ventana Systems to improve policy on climate and climate-related equity around the world. Our products are of three types: user-friendly simulators; presentations and reports on our own analyses; and mind-blowing simulation-based games and workshops.
What is distinctive in your approach?
We pay particularly close attention to the user experience of our online simulations — they are the first step in building the capacity of thousands of global partners to drive change using our tools.
What is your role at Climate Interactive?
I’m co-founder and co-director of CI, which is a team of 16 staff and 12 primary contractors. I direct and contribute to the modeling but am no longer involved in writing equations.
What decisions do you have to make about the simulators and workshops?
When I’m preparing to engage a group with a SD model, I ask myself: What are the conditions and experiences we need to create so that the engagement will succeed? This starts, of course, with having the right focus, level of aggregation, boundary, and structure of the model. But also: What should the interface look like? How can we help people get engaged with the simulator?
How did you originally get interested in SD, and when was that?
I was introduced to SD by Dana Meadows in 1988, when I was a student at Dartmouth College.
What individuals and organizations are inspirations to you?
I have had memorable experiences with many “SD heroes” and mentors over the years, and they have influenced my own approach. In 1989, I saw Steve Peterson and Barry Richmond capture system structure with causal language and rigorous precision. A few years later, I saw Dana Meadows during her Beyond the Limits book tour presenting World3 scenarios, moving fluidly from model dynamics to heart-filled empathy, to defiant challenging, and then back again to model dynamics. After that, as a participant in Dennis Meadows’ Fishbanks game, I saw how his mischievous facilitation could bring people’s sometimes irrational assumptions and behavior to the surface. Then, in the late 1990s, I watched John Sterman thrill a huge auditorium of students, asking the perfect questions to build a 20-loop causal diagram interactively in real time. Also, I recall, around 2000, seeing Peter Senge showing deep respect for the current mental models of his audience, putting them in the right frame of mind to learn something new. A final experience that influenced me was watching Jim Hines use levity and humor, not just for entertainment, but also as a way to welcome participants into a playful, virtual “what if” world of one’s model.
What accomplishments are you proud of?
The Obama Administration used C-ROADS to achieve its 2014 US-China bilateral climate agreement that set up the Paris Agreement. Also, we have seen ever-growing use of the simulators all over the world – 1,499 certified facilitators have reached 121,484 people. Many legislators in the US Congress have experienced the simulators, and high-ups in the Biden Administration have seen and worked with them.
What kinds of work would you like to be doing over the next 5 years?
I’d like for us to help drive global greenhouse gas emissions down instead of up.
If you have any additional questions or comments, leave a note below! Otherwise, find Drew at www.climateinteractive.org.
Recent Posts
From Bergen to Global: UiB’s System Dynamics Group
From Bergen to Global: UiB’s System Dynamics Group The System Dynamics Group, an autonomous research group at the University of Bergen (UiB) was established in 1971 by professor emeritus Svein Nordbotten. Inspired by the work of Jay W. Forrester, Nordbotten...
Consideo’s Insight into the Global Energy Transition: A Systems Perspective
Consideo’s Insight into the Global Energy Transition: A Systems Perspective Complexities of Energy TransitionThe global energy transition is a complex challenge. The development of technology, the need for resources, the depletion of high-grade materials and...
A Digital Twin Business Model in 40 Hours
A Digital Twin Business Model in 40 Hours Though long past the date when I should have ‘retired’, I just can’t resist interesting projects, like the one a new friend brought me a few weeks ago. It concerns a small but fast-growing B2B business,...
Upcoming Events
From Text to Map: A System Dynamics Bot for Constructing Causal Loop Diagrams
May, 15 at 11 am NY | 4 pm London | 11 pm Beijing | Time Converter From Text to Map: A System Dynamics Bot for Constructing Causal Loop Diagrams Join us to delve into the innovative System Dynamics Bot, a tool designed to automate causal loop diagram creation from...
Recent Business cases
Fast-Track Cities Uses System Dynamics to Enhance HIV Care
Fast-Track Cities Uses System Dynamics to Enhance HIV Care EXECUTIVE Summary Low levels of viral suppression at 69% for people with HIV make it hard to believe the 95% target level will be achieved by 2030 in St. Louis, USA. As a solution, Fast-Track Cities-STL opted...
System Dynamics Unravels ICU Tensions at the Portuguese Oncology Institute
System Dynamics Unravels ICU Tensions at the Portuguese Oncology Institute EXECUTIVE Summary The Portuguese Oncology Institute (IPO) faced a critical challenge in its intensive care unit (ICU) where doctors and nurses experienced high turnover due to tensions with...
System Dynamics Helps Farmers Escape Poverty Trap in Guatemala
System Dynamics Helps Farmers Escape Poverty Trap in Guatemala EXECUTIVE Summary Guatemala holds the 4th highest global ranking for chronic malnutrition, and climate change is intensifying the challenges subsistence farmers face in providing food for their families....
Join us
Webinar Q&A | Group Model Building Online

Webinar Q&A | Group Model Building Online
|


| Any attempts at asynchronous group model building? |
|
No, we have so far only worked synchronously. However, A considerable number of seminar participants, however, did have experience with asynchronous group model building and reported on it during the discussion
|
| How do you see virtual model building fitting in with in-person model building when we have that opportunity again? For example, do you think that there is value in a two-stage event with one stage virtual and one in person (in either order)? |
|
Online Group Model Building (GMB) has its pros and cons, and it is important to keep them in mind. One big advantage of online GMB is of course the amount of time, money, and not least carbon emissions that can be saved. With social dynamics and power relations being very important, a combination of the two – virtual and in-person once we have that opportunity again – seems like a perfect fit.
|
| How much preparation time has this added to the process? |
|
It is difficult to give a precise answer. For our very first online GMB workshop, we spent, in total, between two and three months for preparation. Some of this was not related to the workshop being online. Most of the preparation time was due to exploring the tools and functionality of the online platform, designing the board from scratch, and adjusting the scripts in parallel. It helped to have a person who dedicated time to this and then trained the rest of the team in no longer than a couple of hours. After the material has been developed, we had a couple of practice rounds to ensure the team is in sync. Now that we have done this several times there is hardly any extra preparation time.
|
| How does the causal loop formation work in the group? What if people do not agree on connections? |
|
This is, of course, a big challenge, but it is a challenge that is independent of the online versus in-person format of group model-building workshops. In our experience (both online and in-person), disagreements can usually be resolved by carefully breaking down the process in operational steps and by iterating a causal loop diagram and eventually a simulation model over several workshops.
|
| How big a group do you think the online setup allows for? Is there a maximum number of participants? |
|
This is a bit difficult to answer – it definitely depends on the scripts one chooses. For larger groups, we usually try to have more divergent activities where work done in smaller groups during the workshop. We have tried with multiple groups working in parallel and there was no platform-related issue.
|
| Can you export data from the Miro board? Or import data into another software for data analysis purposes? |
|
You can export all contents of a Miro board either as images or in a pdf “booklet”. All data, however, need to be manually transferred to other software. For example, the behavior the participants identify in the Graphs Over Time are drawings, not data points, so they cannot be imported for any direct analysis. Similarly for the Causal Loop Diagram.
|
| How can you protect the board so it can’t be messed up by some of the participants? |
|
You can change the Sharing options at any point in time to withdraw editing rights from participants. There are numerous sharing options for both the Miro Team members (the core modeling team) and stakeholders who are usually invited through a link. For example, they can have editing rights, be able to only view the board, or have no access at all. This page provides some more information. Another very helpful function is the ability to “lock” specific elements on the board. Elements that are locked cannot be moved unless they get “unlocked”. You can find more information here. In our case, we had locked all elements of the board except for the Graphs Over Time templates and the Action Ideas templates, both of which needed to be moved by the participants/team.
|
| Did everyone have access to touch-sensitive devices/styluses? Or were there setbacks in drawing BOTGs? |
|
Most people drew the graphs with their mouse/touchpad. This might not allow for the most nicely drawn or very detailed graphs, but we were interested in broad trends so, in our experience, this worked fine. We didn’t observe any significant delays or received any questions around this part, although it might be a bit slower than drawing on paper, as is to be expected. Something that might have helped was that we had shared with the participants a short video on using the “pen” tool and that we asked them to use it in the Icebreaker as well.
|
| When the participants are drawing the behavior over time charts, do you go through with each of the participants what each variable means? When I do GMB I find it tricky to balance the time between letting the participants explain the variable and getting a hold of the time. |
|
Yes, we usually discuss behavior over time graphs in a round-robin fashion. But if time is very limited, we might not go through all the variables participants have identified. Instead, we ensure of course that participants share the same number of variables each.
|
|
To clarify: you had groups of people work together? Where these groups then physically together in one place but working online with other groups? Or how was the setup?
|
|
In the workshop we presented in the seminar, there were two independent groups on two separate Miro boards, each with their own modeling team (facilitator, modeler, stage manager, and note-taker). All participants were working from their own location individually and interacting only virtually with the rest of their group. We have since run a workshop with participants in a group being physically together while the modeling team was online and found it quite challenging. In this case, however, there wasn’t any equipment set up that could potentially make the setting work (for example, microphone(s) in the room where members are physically present, or a projector for the Miro environment).
|
| After the workshop, what content did you share with the participants? |
|
We exported and shared the image of the Causal Loop area. In addition, participants still had the link to the Miro board with all the workshop activities.
|
| There was stuff around the causal loop creation table on the Miro board. What was it and what was it for? |
|
Around the Causal Loop frame, there is an overview of the script (left-side), and the elements for the Action Ideas script (right-side). The Action Ideas are not part of the process of developing the causal map and were not “in the view” when the group was working on it (in other words, the focus on the screen was on the Causal Loop frame).
|
| I’d like to reinforce the tremendous opportunity that lies ahead. Over the past year, I suggest the world has been forced to jump ahead at least five years regarding on-line group meetings, etc. Thanks for leading the way! We’ve only just begun! |
|
Thank you. We couldn’t agree more. Going online opens up new opportunities. We just need to make sure that we do not introduce and/or reinforce digital inequality. This is, of course, easier said than done.
|
| Why did you choose Miro and not Mural? |
|
The honest answer is that we were not aware of Mural at the time so it wasn’t a very conscious decision! It seems to be quite similar so it could be a good alternative. However, what Mural seems to not offer is the built-in video conferencing that Miro allows. This can help, since participants are not simultaneously in two platforms, Miro and e.g. Zoom. The downside is that, at least until recently, Miro’s video conferencing did not offer a “gallery view” of the participants; that is, one cannot view all participants simultaneously. The other thing to note here is, for the stakeholders to be able to join the Miro video call, they need to have signed up to the platform in advance (anonymous users cannot participate in the video call).
|
| Can you elaborate more on the role of the “stage manager” please? I’m curious to hear about the coordination and choreography before and during the workshop. |
|
Absolutely! The first thing to say is that there was one common script with all three roles (facilitator, modeler, and stage manager) that was developed based on the facilitator’s experience with GMB and the “run-throughs” that one team went through. The script was quite detailed – as an example, when participants were sharing their Graphs Over Time, the script would describe something as: “Facilitator asks for volunteer participants to share their favorite graph. Stage Manager Zooms in on the participant’s desk and the graph they describe. After the graph has been described, the Stage Manager zooms out. The facilitator informs that modeler will move the graph to the clustering area and the modeler does so. The facilitator asks for a second volunteer participant” While perhaps a bit tedious to produce in this detail (it took us certainly two run-throughs of the entire workshop, already starting with a written facilitator script), it was very helpful for us to run our first workshop. Also of note, we did use a lot of Screen Sharing within Miro, hence the Stage Manager was mainly following the “action” to ensure the participants see what is relevant for the activity. What was interesting during the workshop was that the participants asked on occasions the Stage Manager to show them some element that was out of view. With this, we mean that it seemed important to treat this role not as someone “going through the moves” but as someone the participants can interact with. The facilitator announcing the actions of the Stage Manager (e.g. <name> will now take us to the Overview of our next activity) and the Stage Manager asking the participants if the view is ok might have helped in this respect.
|
| Are there other platforms besides Miro and Mural that you explored? |
|
We would like to take this opportunity to acknowledge and thank all those who shared their own experiences with Online Systems Mapping. Here are some of the platforms that other seminar participants mentioned and/or had experience with: Miro in combination with Zoom (also in breakout rooms); Video conferencing with shared Vensim screen; a combination of Padlet for pre-work and Loopy for a virtual workshop, in an asynchronous setting; Kumu; Mural; InsightMaker. Definitely check this very insightful note in System Dynamics Review that Nici Zimmerman and her collaborators have published (Moving online: reflections from conducting systems dynamics workshops in virtual settings). As well as this webinar (Community Model Building – Drought) from iseesystems. |
Recent Posts
From Bergen to Global: UiB’s System Dynamics Group
From Bergen to Global: UiB’s System Dynamics Group The System Dynamics Group, an autonomous research group at the University of Bergen (UiB) was established in 1971 by professor emeritus Svein Nordbotten. Inspired by the work of Jay W. Forrester, Nordbotten...
Consideo’s Insight into the Global Energy Transition: A Systems Perspective
Consideo’s Insight into the Global Energy Transition: A Systems Perspective Complexities of Energy TransitionThe global energy transition is a complex challenge. The development of technology, the need for resources, the depletion of high-grade materials and...
A Digital Twin Business Model in 40 Hours
A Digital Twin Business Model in 40 Hours Though long past the date when I should have ‘retired’, I just can’t resist interesting projects, like the one a new friend brought me a few weeks ago. It concerns a small but fast-growing B2B business,...
Upcoming Events
MINDS Cast Ep. 5 – Expanding System Dynamics with Hybrid Modeling w/ Scott Fortmann
This talk discusses extensions to System Dynamics modeling to integrate other modeling methods, notably Agent-Based Modeling. We will explore techniques for Agent-Based Modeling and how to integrate them into System Dynamics models; we will see how to extend...
Recent Business cases
Fast-Track Cities Uses System Dynamics to Enhance HIV Care
Fast-Track Cities Uses System Dynamics to Enhance HIV Care EXECUTIVE Summary Low levels of viral suppression at 69% for people with HIV make it hard to believe the 95% target level will be achieved by 2030 in St. Louis, USA. As a solution, Fast-Track Cities-STL opted...
System Dynamics Unravels ICU Tensions at the Portuguese Oncology Institute
System Dynamics Unravels ICU Tensions at the Portuguese Oncology Institute EXECUTIVE Summary The Portuguese Oncology Institute (IPO) faced a critical challenge in its intensive care unit (ICU) where doctors and nurses experienced high turnover due to tensions with...
System Dynamics Helps Farmers Escape Poverty Trap in Guatemala
System Dynamics Helps Farmers Escape Poverty Trap in Guatemala EXECUTIVE Summary Guatemala holds the 4th highest global ranking for chronic malnutrition, and climate change is intensifying the challenges subsistence farmers face in providing food for their families....

Models, Maps, and Levels of Evidence

Models, Maps, and Levels of Evidence
Anyone who has attended a System Dynamics conference in recent years, or has read past posts in the System Dynamics Society blog, is surely aware of differences of opinion on the value of qualitative maps as opposed to quantified simulations.
What you may not know is that this debate has been going on for a long time, stretching back to the early 1980s, when Eric Wolstenholme and others asserted that one might be able to infer dynamics from qualitative maps. In 1990, Peter Senge’s book The Fifth Discipline upped the ante by suggesting that certain problems might be categorized according to System Archetypes, which some took to mean that one could go directly to solutions without first simulating. This became known as Systems Thinking.
In 2000, Geoff Coyle wrote a paper (SDR 2000, 16:3) that pointedly asked whether there might be situations so uncertain that quantified modeling cannot tell us more than qualitative mapping alone. Rogelio Oliva and I wrote a rejoinder (SDR 2001, 17:4) that challenged this idea and sought to reclaim Jay Forrester’s original view of simulation as the necessary test bed for any dynamic hypothesis that might conceivably lead to policy decisions.
Even now, 20 years later, the debate continues. We see in our conferences increasing use of Group Model Building that goes no further than a qualitative map, and from which the authors claim to have derived dynamic insights.
Some have been dismayed by this development—which appears to be the further expansion of Systems Thinking—fearing it is diluting and dumbing down the fundamentals of our field. The modelers accuse the mappers of lacking rigor, while the mappers say that good group process has a rigor of its own.
What can we do about this long-brewing pot of trouble?
Is there any way out of the impasse?
I’d like to suggest a possibility. Several years ago, I published a paper (SDR 2014, 30:1-2) describing how a “levels of evidence” approach—a standard for classifying work in the biomedical sciences—might be applied in SD. To achieve an “A” level of evidence, one would need both strong structural and behavioral evidence and the ability to reliably test one’s model.
Structural evidence comes from conversations with subject matter experts and focused studies of cause and effect. Behavioral evidence comes from a comparison of model output with time series data and historical records. Work with strong support for structure but not behavior, or behavior but not structure, would achieve at best a “B” rating. Work with strong support for neither would get a “C” rating.
In the biomedical sciences, works that have “B” or “C” ratings can still be presented at conferences and even appear in prestigious journals. A rating less than “A” does not mean poor quality but rather lack of full, iron-clad reliability for drawing conclusions and making decisions; that is, something more exploratory or tentative. Its level of evidence is designated in the conference proceedings or at the top of the paper so that the audience knows what they are dealing with—a decisive work (one from which decisions can be made with confidence) or something less than that.
It seems to me we can apply the Levels of Evidence filter objectively across both simulation models and qualitative maps. Let’s start with the simple fact that a simulation model can be tested formally, while a qualitative map cannot. It follows that the best possible rating for a simulation model is “A”, while the best possible for a qualitative map is “B”.
If we can agree on this much, then we may be able to find a way for simulation models and qualitative maps to coexist. It would require acknowledgment from the advocates of qualitative maps that their work can never be considered decisive. And, it would require acknowledgment from the advocates of simulation that a model lacking sufficient evidence may be no more reliable than a well-developed qualitative map.
Recent Posts
From Bergen to Global: UiB’s System Dynamics Group
From Bergen to Global: UiB’s System Dynamics Group The System Dynamics Group, an autonomous research group at the University of Bergen (UiB) was established in 1971 by professor emeritus Svein Nordbotten. Inspired by the work of Jay W. Forrester, Nordbotten...
Consideo’s Insight into the Global Energy Transition: A Systems Perspective
Consideo’s Insight into the Global Energy Transition: A Systems Perspective Complexities of Energy TransitionThe global energy transition is a complex challenge. The development of technology, the need for resources, the depletion of high-grade materials and...
A Digital Twin Business Model in 40 Hours
A Digital Twin Business Model in 40 Hours Though long past the date when I should have ‘retired’, I just can’t resist interesting projects, like the one a new friend brought me a few weeks ago. It concerns a small but fast-growing B2B business,...
Upcoming Events
MINDS Cast Ep. 5 – Expanding System Dynamics with Hybrid Modeling w/ Scott Fortmann
This talk discusses extensions to System Dynamics modeling to integrate other modeling methods, notably Agent-Based Modeling. We will explore techniques for Agent-Based Modeling and how to integrate them into System Dynamics models; we will see how to extend...
Recent Business cases
Fast-Track Cities Uses System Dynamics to Enhance HIV Care
Fast-Track Cities Uses System Dynamics to Enhance HIV Care EXECUTIVE Summary Low levels of viral suppression at 69% for people with HIV make it hard to believe the 95% target level will be achieved by 2030 in St. Louis, USA. As a solution, Fast-Track Cities-STL opted...
System Dynamics Unravels ICU Tensions at the Portuguese Oncology Institute
System Dynamics Unravels ICU Tensions at the Portuguese Oncology Institute EXECUTIVE Summary The Portuguese Oncology Institute (IPO) faced a critical challenge in its intensive care unit (ICU) where doctors and nurses experienced high turnover due to tensions with...
System Dynamics Helps Farmers Escape Poverty Trap in Guatemala
System Dynamics Helps Farmers Escape Poverty Trap in Guatemala EXECUTIVE Summary Guatemala holds the 4th highest global ranking for chronic malnutrition, and climate change is intensifying the challenges subsistence farmers face in providing food for their families....
Join us
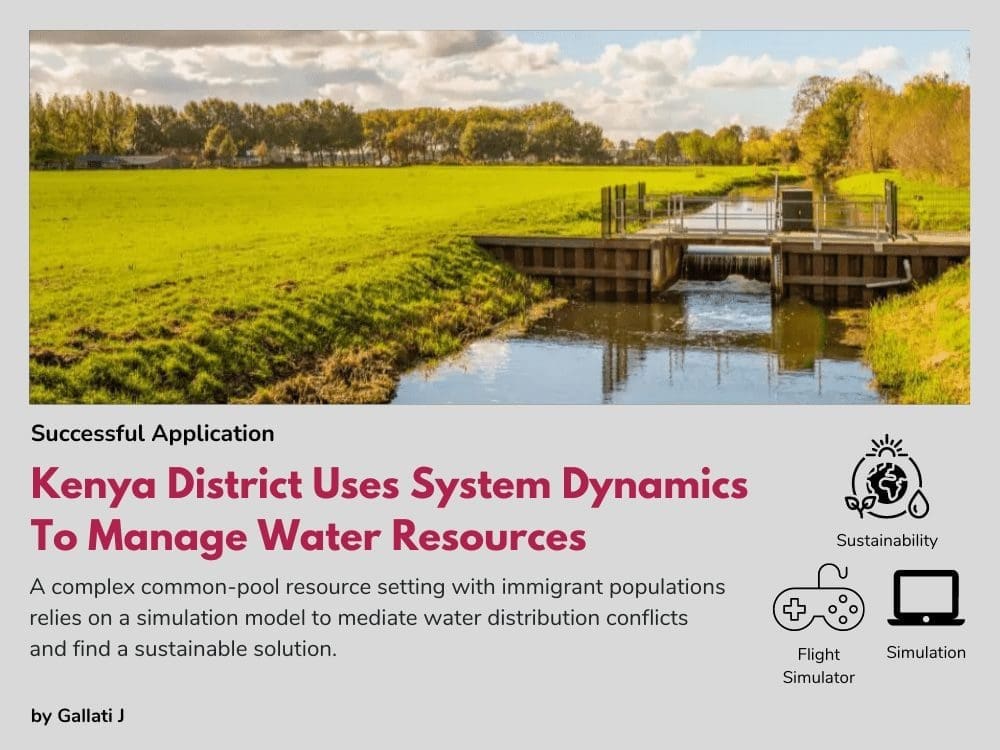
Kenya District Uses System Dynamics To Manage Water Resources
Sustainable management of natural resources is a vital concern in most countries and regions worldwide. In Laikipia District in Kenya, located at the foothill zone of Mt. Kenya, water is required in the upper zone for irrigation agriculture, horticultures and livestock production as well as for urban areas. In the lower zone water is required for wildlife and natural habitats.
In an earlier study (Gallati 2008) a system dynamics model has been developed to better understand possible dynamics in collective irrigation management focusing on the feedbacks between social mechanisms of collective action and the performance of the irrigation practices. In Laikipia, however, it turned out that this model was not applicable due to the fact that large immigration had taken place in the last decades preventing inhabitants from developing close relations of exchange and reciprocity, which had been key preconditions of this model.
A stakeholder workshop in 2009 revealed that the transition towards new water management practices is one of the key concerns in the area.
Based on these insights a system dynamics model has been developed to demonstrate the effect of new water management practices in different zones along the river reflecting the fact of varying rainfall and agricultural options from uphill to downhill zone and down to the plains. In particular the users can experiment with different options such as storage capacity, increase of water use efficiency, use of flood flow, adaptation of agricultural practices, etc.
in order to analyze the effect of these practices on overall production and income. As such it is envisaged to support local participants in adopting a river (basin) perspective. The usefulness of the model is being evaluated in a second stakeholder workshop in 2010. Based on this experience further model development will be evaluated. One option is to further develop the model into a tool for broader use in capacity building and training for sustainable water management in collaboration with local or international institutions.
The project is developed in collaboration with CETRAD (Centre for Training and Integrated Research in Arid and Semi-Arid Areas Development; www.cetrad.org) in Nanyuki, Kenya and is part of a larger research initiative on sustainable natural resources management. It is supported by NCCR North-South in Switzerland, which is funded by the Swiss Development Agency and the Swiss National Fund.
Contact and further information: Justus Gallati, Lucerne University of Applied Sciences justus.gallati@hslu.ch.
| Client | CETRAD |
|---|---|
| Author/Consultant | Gallati J |
More Information
| Gallati J. 2008. Towards an improved understanding of collective irrigation management: a System Dynamics approach. [PhD Dissertation]. Berne Switzerland: University of Berne. |
OTHER SUCCESSFUL APPLICATIONS
Fast-Track Cities Uses System Dynamics to Enhance HIV Care
Fast-Track Cities Uses System Dynamics to Enhance HIV Care EXECUTIVE Summary Low levels of viral suppression at 69% for people with HIV make it hard to believe the 95% target level will be achieved by 2030 in St. Louis, USA. As a solution, Fast-Track Cities-STL opted...
System Dynamics Unravels ICU Tensions at the Portuguese Oncology Institute
System Dynamics Unravels ICU Tensions at the Portuguese Oncology Institute EXECUTIVE Summary The Portuguese Oncology Institute (IPO) faced a critical challenge in its intensive care unit (ICU) where doctors and nurses experienced high turnover due to tensions with...
System Dynamics Helps Farmers Escape Poverty Trap in Guatemala
System Dynamics Helps Farmers Escape Poverty Trap in Guatemala EXECUTIVE Summary Guatemala holds the 4th highest global ranking for chronic malnutrition, and climate change is intensifying the challenges subsistence farmers face in providing food for their families....
Upcoming Events
From Text to Map: A System Dynamics Bot for Constructing Causal Loop Diagrams
May, 15 at 11 am NY | 4 pm London | 11 pm Beijing | Time Converter From Text to Map: A System Dynamics Bot for Constructing Causal Loop Diagrams Join us to delve into the innovative System Dynamics Bot, a tool designed to automate causal loop diagram creation from...
Recent Posts
From Bergen to Global: UiB’s System Dynamics Group
From Bergen to Global: UiB’s System Dynamics Group The System Dynamics Group, an autonomous research group at the University of Bergen (UiB) was established in 1971 by professor emeritus Svein Nordbotten. Inspired by the work of Jay W. Forrester, Nordbotten...
Consideo’s Insight into the Global Energy Transition: A Systems Perspective
Consideo’s Insight into the Global Energy Transition: A Systems Perspective Complexities of Energy TransitionThe global energy transition is a complex challenge. The development of technology, the need for resources, the depletion of high-grade materials and...
A Digital Twin Business Model in 40 Hours
A Digital Twin Business Model in 40 Hours Though long past the date when I should have ‘retired’, I just can’t resist interesting projects, like the one a new friend brought me a few weeks ago. It concerns a small but fast-growing B2B business,...
Join us
OTHER SUCCESSFUL APPLICATIONS
Fast-Track Cities Uses System Dynamics to Enhance HIV Care
Fast-Track Cities Uses System Dynamics to Enhance HIV Care EXECUTIVE Summary Low levels of viral suppression at 69% for people with HIV make it hard to believe the 95% target level will be achieved by 2030 in St. Louis, USA. As a solution, Fast-Track Cities-STL opted...
System Dynamics Unravels ICU Tensions at the Portuguese Oncology Institute
System Dynamics Unravels ICU Tensions at the Portuguese Oncology Institute EXECUTIVE Summary The Portuguese Oncology Institute (IPO) faced a critical challenge in its intensive care unit (ICU) where doctors and nurses experienced high turnover due to tensions with...
System Dynamics Helps Farmers Escape Poverty Trap in Guatemala
System Dynamics Helps Farmers Escape Poverty Trap in Guatemala EXECUTIVE Summary Guatemala holds the 4th highest global ranking for chronic malnutrition, and climate change is intensifying the challenges subsistence farmers face in providing food for their families....
Recent Posts
From Bergen to Global: UiB’s System Dynamics Group
From Bergen to Global: UiB’s System Dynamics Group The System Dynamics Group, an autonomous research group at the University of Bergen (UiB) was established in 1971 by professor emeritus Svein Nordbotten. Inspired by the work of Jay W. Forrester, Nordbotten...
Consideo’s Insight into the Global Energy Transition: A Systems Perspective
Consideo’s Insight into the Global Energy Transition: A Systems Perspective Complexities of Energy TransitionThe global energy transition is a complex challenge. The development of technology, the need for resources, the depletion of high-grade materials and...
A Digital Twin Business Model in 40 Hours
A Digital Twin Business Model in 40 Hours Though long past the date when I should have ‘retired’, I just can’t resist interesting projects, like the one a new friend brought me a few weeks ago. It concerns a small but fast-growing B2B business,...
Upcoming Events
From Text to Map: A System Dynamics Bot for Constructing Causal Loop Diagrams
May, 15 at 11 am NY | 4 pm London | 11 pm Beijing | Time Converter From Text to Map: A System Dynamics Bot for Constructing Causal Loop Diagrams Join us to delve into the innovative System Dynamics Bot, a tool designed to automate causal loop diagram creation from...
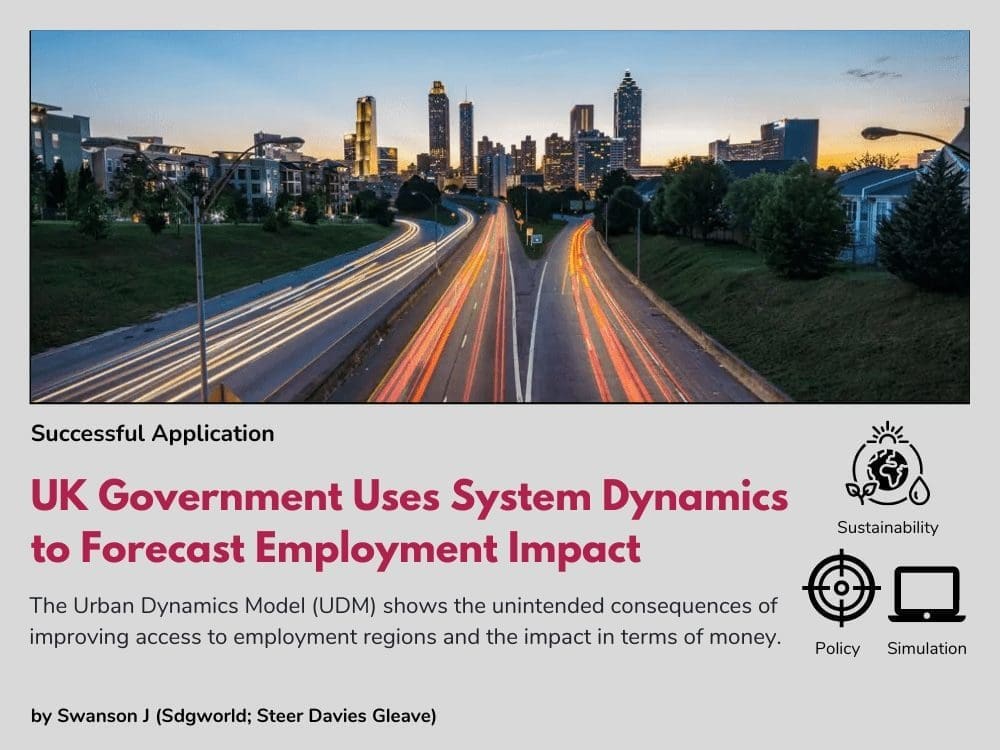
UK Government Uses System Dynamics to Forecast Employment Impact
The Urban Dynamic Model (UDM) is a simulation of how transport interacts with population, employment and land-use over long periods of time, typically ten years or more. It was developed to help understand how transport could contribute to economic regeneration by improving the ability of employers to recruit a workforce and their access to customers and suppliers, and by improving access to employment opportunities.
For example, the vicious circle of congestion is familiar to us all but is almost impossible to capture in traditional models. In short, the cycle includes improved transport which reduces travel time, making businesses easier to access for customers, generating increased employment, leading to more transport activity and increased congestion.
The UDM was developed over a number of years, beginning with a fairly simple model built in 2000. This was used in one of a series of large scale transport studies commissioned by the government at the time. Its role at that time was to test the regeneration claims being made for a proposed by-pass that would have passed through an area of outstanding natural beauty. Models of this type must be able to represent the spatial characteristics of the study area, usually using a zone structure, and the road and public transport links connecting the zones together. Other applications followed, and then in 2005 we were commissioned by the Department for transport to carry out a study into the impact of transport on business location decisions. Current guidance from the Department for Transport emphasises the wider role of transport in supporting the economy, but also points to the need for reducing carbon dioxide emissions.
The UDM is generic, and has been applied widely in the UK with local authorities. Conclusions vary from one application to another, but some of the findings we have reported include measures to generate employment can appear to have a significant effect if examined very locally, but we often find that some employment is transferred from elsewhere, and the net effect can be less than might first appear, city centres remain the best locations for many types of employer because they provide the best access to a workforce and bring ‘agglomeration’ benefits that employers enjoy by being clustered together. Studies of major programmes of transport investment typically involve expenditure of tens or hundreds of millions of pounds. The measured benefits are usually expressed in money, and expressing both the social and economic impacts of investment and can also run to hundreds of millions of pounds.
| Client | UK local authorities |
|---|---|
| Authors/Consultants | Swanson J (Sdgworld; Steer Davies Gleave) |
More Information
| For more information on this case, please contact John Swanson at Sdgworld, or see this link. |
OTHER SUCCESSFUL APPLICATIONS
Fast-Track Cities Uses System Dynamics to Enhance HIV Care
Fast-Track Cities Uses System Dynamics to Enhance HIV Care EXECUTIVE Summary Low levels of viral suppression at 69% for people with HIV make it hard to believe the 95% target level will be achieved by 2030 in St. Louis, USA. As a solution, Fast-Track Cities-STL opted...
System Dynamics Unravels ICU Tensions at the Portuguese Oncology Institute
System Dynamics Unravels ICU Tensions at the Portuguese Oncology Institute EXECUTIVE Summary The Portuguese Oncology Institute (IPO) faced a critical challenge in its intensive care unit (ICU) where doctors and nurses experienced high turnover due to tensions with...
System Dynamics Helps Farmers Escape Poverty Trap in Guatemala
System Dynamics Helps Farmers Escape Poverty Trap in Guatemala EXECUTIVE Summary Guatemala holds the 4th highest global ranking for chronic malnutrition, and climate change is intensifying the challenges subsistence farmers face in providing food for their families....
Upcoming Events
From Text to Map: A System Dynamics Bot for Constructing Causal Loop Diagrams
May, 15 at 11 am NY | 4 pm London | 11 pm Beijing | Time Converter From Text to Map: A System Dynamics Bot for Constructing Causal Loop Diagrams Join us to delve into the innovative System Dynamics Bot, a tool designed to automate causal loop diagram creation from...
Recent Posts
From Bergen to Global: UiB’s System Dynamics Group
From Bergen to Global: UiB’s System Dynamics Group The System Dynamics Group, an autonomous research group at the University of Bergen (UiB) was established in 1971 by professor emeritus Svein Nordbotten. Inspired by the work of Jay W. Forrester, Nordbotten...
Consideo’s Insight into the Global Energy Transition: A Systems Perspective
Consideo’s Insight into the Global Energy Transition: A Systems Perspective Complexities of Energy TransitionThe global energy transition is a complex challenge. The development of technology, the need for resources, the depletion of high-grade materials and...
A Digital Twin Business Model in 40 Hours
A Digital Twin Business Model in 40 Hours Though long past the date when I should have ‘retired’, I just can’t resist interesting projects, like the one a new friend brought me a few weeks ago. It concerns a small but fast-growing B2B business,...
Join us
OTHER SUCCESSFUL APPLICATIONS
Fast-Track Cities Uses System Dynamics to Enhance HIV Care
Fast-Track Cities Uses System Dynamics to Enhance HIV Care EXECUTIVE Summary Low levels of viral suppression at 69% for people with HIV make it hard to believe the 95% target level will be achieved by 2030 in St. Louis, USA. As a solution, Fast-Track Cities-STL opted...
System Dynamics Unravels ICU Tensions at the Portuguese Oncology Institute
System Dynamics Unravels ICU Tensions at the Portuguese Oncology Institute EXECUTIVE Summary The Portuguese Oncology Institute (IPO) faced a critical challenge in its intensive care unit (ICU) where doctors and nurses experienced high turnover due to tensions with...
System Dynamics Helps Farmers Escape Poverty Trap in Guatemala
System Dynamics Helps Farmers Escape Poverty Trap in Guatemala EXECUTIVE Summary Guatemala holds the 4th highest global ranking for chronic malnutrition, and climate change is intensifying the challenges subsistence farmers face in providing food for their families....
Recent Posts
From Bergen to Global: UiB’s System Dynamics Group
From Bergen to Global: UiB’s System Dynamics Group The System Dynamics Group, an autonomous research group at the University of Bergen (UiB) was established in 1971 by professor emeritus Svein Nordbotten. Inspired by the work of Jay W. Forrester, Nordbotten...
Consideo’s Insight into the Global Energy Transition: A Systems Perspective
Consideo’s Insight into the Global Energy Transition: A Systems Perspective Complexities of Energy TransitionThe global energy transition is a complex challenge. The development of technology, the need for resources, the depletion of high-grade materials and...
A Digital Twin Business Model in 40 Hours
A Digital Twin Business Model in 40 Hours Though long past the date when I should have ‘retired’, I just can’t resist interesting projects, like the one a new friend brought me a few weeks ago. It concerns a small but fast-growing B2B business,...
Upcoming Events
From Text to Map: A System Dynamics Bot for Constructing Causal Loop Diagrams
May, 15 at 11 am NY | 4 pm London | 11 pm Beijing | Time Converter From Text to Map: A System Dynamics Bot for Constructing Causal Loop Diagrams Join us to delve into the innovative System Dynamics Bot, a tool designed to automate causal loop diagram creation from...
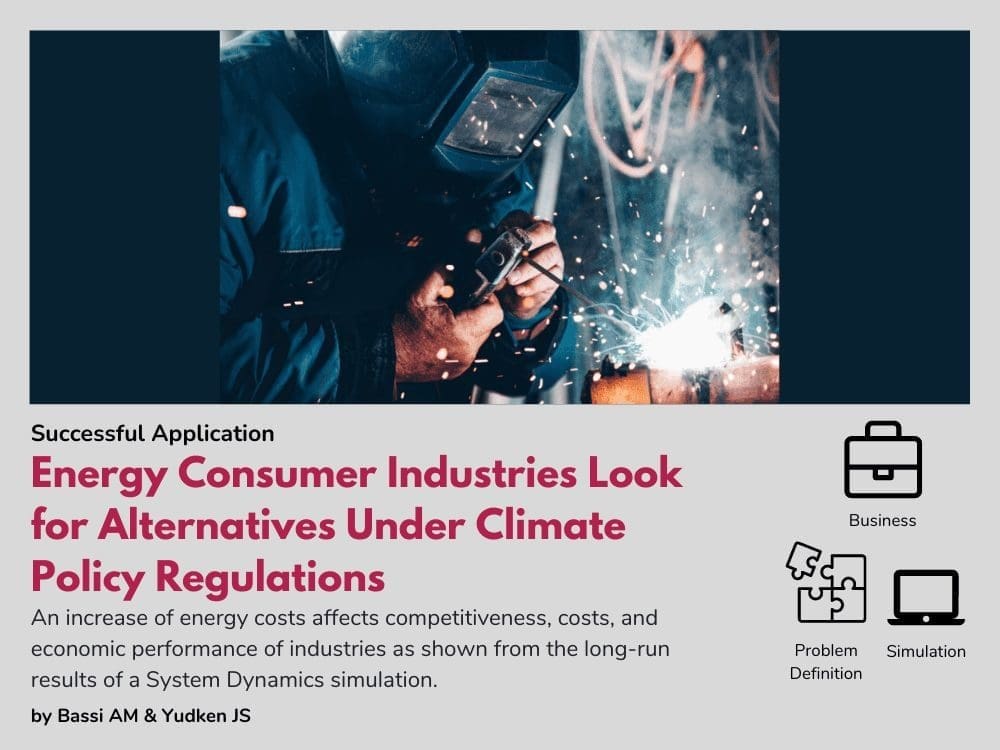
Energy Consumer Industries Look for Alternatives Under Climate Policy Regulations
Four industries – iron and steel, aluminum, paper and pulp, and chemicals – account for nearly half of the energy consumed by U.S. manufacturing industries and over 10 percent of total U.S. energy consumption, making them highly vulnerable to volatile energy prices. Millennium Institute and High Road Strategies collaborated on three connected study commissioned by the National Commission on Energy Policy, the Environmental Defense Fund and AFL-CIO Working for America Institute (WAI) and developed with support from industry association organizations, to examine how increased energy prices associated with comprehensive and mandatory cap-and-trade climate policy proposals currently being considered by the U.S. Congress would affect the competitiveness of these industries in the long term. The studies also examined the industries’ capabilities and opportunities to mitigate adverse cost impacts and improve their economic performance under different climate policy scenarios.
In short, the findings strongly suggest that over the long-run, technologies are available to enable energy-intensive industries to achieve sufficient efficiency gains to offset and manage the additional energy costs arising from a climate policy. However, the authors also strongly believe that the industries analyzed will need additional measures that both mitigate these cost impacts in the short-to-medium term, and policies that encourage and facilitate the transition of energy-reliant companies to a low-carbon future, while enhancing their competitiveness in global markets.
Findings of these studies being circulated starting from Aril 2009 are substantially contributing to the debate on the introduction of climate regulations, both in the US and abroad.
| Client | National Commission on Energy Policy, Environmental Defense Fund, WAI |
|---|---|
| Authors/Consultants | Bassi AM, Yudken JS |
More Information
| Yudken J.S. and Bassi A.M. (2009). Climate change and US Competitiveness. Issues in Science and Technology, Fall Issue. |
| Bassi A.M. and Yudken J.S. (2009). Potential challenges faced by the U.S. chemicals industry under a carbon policy. Sustainability 1: 592-611. Special issue on Energy Policy and Sustainability. |
| Yudken J.S. and Bassi J.S. (2009). Climate policy and energy-intensive manufacturing: the competitiveness impacts of the American energy and security act of 2009. High Road Strategies and Millennium Institute, February 2010, Washington DC, USA. Prepared for the Environmental Defense Fund (EDF). |
OTHER SUCCESSFUL APPLICATIONS
Fast-Track Cities Uses System Dynamics to Enhance HIV Care
Fast-Track Cities Uses System Dynamics to Enhance HIV Care EXECUTIVE Summary Low levels of viral suppression at 69% for people with HIV make it hard to believe the 95% target level will be achieved by 2030 in St. Louis, USA. As a solution, Fast-Track Cities-STL opted...
System Dynamics Unravels ICU Tensions at the Portuguese Oncology Institute
System Dynamics Unravels ICU Tensions at the Portuguese Oncology Institute EXECUTIVE Summary The Portuguese Oncology Institute (IPO) faced a critical challenge in its intensive care unit (ICU) where doctors and nurses experienced high turnover due to tensions with...
System Dynamics Helps Farmers Escape Poverty Trap in Guatemala
System Dynamics Helps Farmers Escape Poverty Trap in Guatemala EXECUTIVE Summary Guatemala holds the 4th highest global ranking for chronic malnutrition, and climate change is intensifying the challenges subsistence farmers face in providing food for their families....
Upcoming Events
From Text to Map: A System Dynamics Bot for Constructing Causal Loop Diagrams
May, 15 at 11 am NY | 4 pm London | 11 pm Beijing | Time Converter From Text to Map: A System Dynamics Bot for Constructing Causal Loop Diagrams Join us to delve into the innovative System Dynamics Bot, a tool designed to automate causal loop diagram creation from...
Recent Posts
From Bergen to Global: UiB’s System Dynamics Group
From Bergen to Global: UiB’s System Dynamics Group The System Dynamics Group, an autonomous research group at the University of Bergen (UiB) was established in 1971 by professor emeritus Svein Nordbotten. Inspired by the work of Jay W. Forrester, Nordbotten...
Consideo’s Insight into the Global Energy Transition: A Systems Perspective
Consideo’s Insight into the Global Energy Transition: A Systems Perspective Complexities of Energy TransitionThe global energy transition is a complex challenge. The development of technology, the need for resources, the depletion of high-grade materials and...
A Digital Twin Business Model in 40 Hours
A Digital Twin Business Model in 40 Hours Though long past the date when I should have ‘retired’, I just can’t resist interesting projects, like the one a new friend brought me a few weeks ago. It concerns a small but fast-growing B2B business,...
Join us
OTHER SUCCESSFUL APPLICATIONS
Fast-Track Cities Uses System Dynamics to Enhance HIV Care
Fast-Track Cities Uses System Dynamics to Enhance HIV Care EXECUTIVE Summary Low levels of viral suppression at 69% for people with HIV make it hard to believe the 95% target level will be achieved by 2030 in St. Louis, USA. As a solution, Fast-Track Cities-STL opted...
System Dynamics Unravels ICU Tensions at the Portuguese Oncology Institute
System Dynamics Unravels ICU Tensions at the Portuguese Oncology Institute EXECUTIVE Summary The Portuguese Oncology Institute (IPO) faced a critical challenge in its intensive care unit (ICU) where doctors and nurses experienced high turnover due to tensions with...
System Dynamics Helps Farmers Escape Poverty Trap in Guatemala
System Dynamics Helps Farmers Escape Poverty Trap in Guatemala EXECUTIVE Summary Guatemala holds the 4th highest global ranking for chronic malnutrition, and climate change is intensifying the challenges subsistence farmers face in providing food for their families....
Recent Posts
From Bergen to Global: UiB’s System Dynamics Group
From Bergen to Global: UiB’s System Dynamics Group The System Dynamics Group, an autonomous research group at the University of Bergen (UiB) was established in 1971 by professor emeritus Svein Nordbotten. Inspired by the work of Jay W. Forrester, Nordbotten...
Consideo’s Insight into the Global Energy Transition: A Systems Perspective
Consideo’s Insight into the Global Energy Transition: A Systems Perspective Complexities of Energy TransitionThe global energy transition is a complex challenge. The development of technology, the need for resources, the depletion of high-grade materials and...
A Digital Twin Business Model in 40 Hours
A Digital Twin Business Model in 40 Hours Though long past the date when I should have ‘retired’, I just can’t resist interesting projects, like the one a new friend brought me a few weeks ago. It concerns a small but fast-growing B2B business,...
Upcoming Events
From Text to Map: A System Dynamics Bot for Constructing Causal Loop Diagrams
May, 15 at 11 am NY | 4 pm London | 11 pm Beijing | Time Converter From Text to Map: A System Dynamics Bot for Constructing Causal Loop Diagrams Join us to delve into the innovative System Dynamics Bot, a tool designed to automate causal loop diagram creation from...
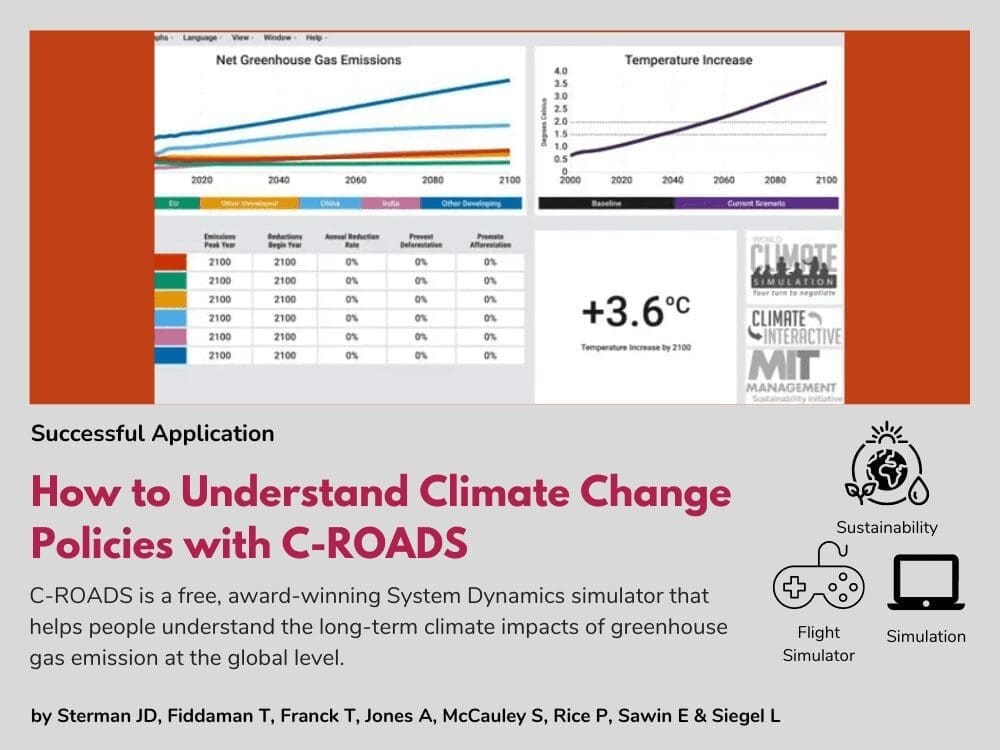
How to Understand Climate Change Policies with C-ROADS
The Dynamics of Climate Change: Understanding and influencing the planet’s future (October 8, 2013)
Presented by Andrew Jones, Co-Director, Climate Interactive
Presentation slides: Dynamics of Climate Change slides
Description: Learn how world leaders are using C-ROADS in global climate negotiations C-ROADS is an award-winning computer simulation that helps people understand the long-term climate impacts of policies designed to reduce greenhouse gas emissions. World leaders are using the model in global climate negotiations. In this interactive session, Andrew Jones, Co-Director of Climate Interactive, introduces participants to C-ROADS and describes how it can be used by others to understand and test their own scenarios or conduct real-time policy analysis. This webinar is the first in the Big Data, System Dynamics, and XMILE webinar series jointly sponsored by IBM, isee systems, and the OASIS XMILE Technical Committee.
The Official Website
![]()
climateinteractive.org is the official website that covers all information about this brilliant project including the latest news, simulators and learning tools, videos, etc.
The Issue You Tackled
Negotiations have failed even though scientific understanding of climate change and the risks it poses ha s never been stronger. The failure of global negotiations can be traced to the gap between the strong scientific consensus on the risks of climate change and widespread confusion, complacency and denial among policymakers, the media and the public.
What You Actually Did
The C-ROADS model is designed to address these issues and build shared understanding of climate dynamics in a way that is solidly grounded in the best available science and rigorously non-partisan, yet understandable by and useful to non-specialists, from policymakers to the public.
The Results
C-ROADS:
-
tracks GHGs, including CO2, CH4, N2O, SF6, halocarbons, aerosols and black carbon;
-
distinguishes emissions from fossil fuels and from land use and forestry policies;
-
allows users to select different business-as-usual (BAU) scenarios, or to define their own;
-
enables users to capture any emissions reduction scenario for each nation portrayed;
-
reports the resulting GHG concentrations, global mean temperature change, sea-level rise, ocean pH, per capita emissions and cumulative emissions;
-
allows users to assess the impact of uncertainty in key climate processes;
How to Work With The Model?
Video tutorials are available online to guide use
| Name | Climate Rapid Overview And Decision Support |
|---|---|
| Modelers | John Sterman, Thomas Fiddaman, Travis Franck, Andrew Jones, Stephanie McCauley, Philip Rice, Elizabeth Sawin, and Lori Siegel |
| Model | To get the model, please follow this link. |
| Client/Participant | Please click here. |
| Client Type | NGO |
Related Publications
| Climate interactive: the C-ROADS climate policy model. | Download |
| Management flight simulators to support climate negotiations | Download |
| Communicating climate change risks in a skeptical world | Download |
| The Climate Scoreboard shows the progress that national contributions (INDCs) to the UN climate negotiations will make assuming no further action after the end of the country’s pledge period (2025 or 2030). | Scoreboard |
| World climate: a role-play simulation of climate negotiations | Download |

A Big Boost for the Climate Summit
An editorial in the New York Times about the climate summit in Paris, mentions C-ROADS team analysis of Intended Nationally Determined Contributions (INDC). Please follow this link to read this article in the NYT.
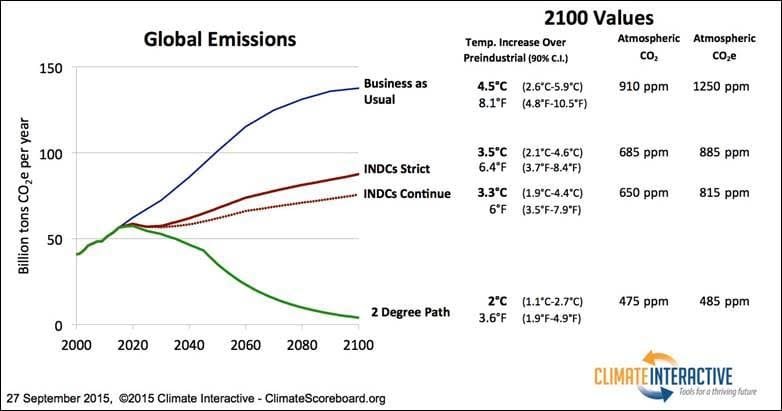
Offers for Paris Climate Talks Would Reduce Warming by 1°C
Climate Interactive’s Climate Scoreboard analysis, produced in partnership with the Massachusetts Institute of Technology Sloan School of Management (MIT Sloan), shows that the intended nationally determined contributions (INDCs) put forward in advance of the UN climate talks this December make a sizeable contribution towards curbing global emissions and limiting warming. However, the offers need to be paired with further action if warming is to be kept below the 2°C target, avoiding the worst impacts of catastrophic climate change. Please see the full news release of their new analysis of the expected impact of the emissions pledges nations have made in the run up to Paris. The climate scoreboard is an embeddable widget that people can embed on their sites, blogs, etc. and will automatically update as analysis is revised when new pledges come in. The New York Times and in Science Magazine Science Insider (dated September 28, 2015) have pick up this story so far.
Climate Interactive announced the World Climate Project at a Back-to-School Climate Education Event at the White House.
The World Climate Exercise is a role-playing simulation game that puts teams, classrooms, and communities into the role of international climate negotiators to create a pathway to solutions that limit global warming. Through these simulation games, Climate Interactive plans to reach more than 10,000 people by December 2015, when nations will come together to finalize a global agreement on climate change in Paris. (Aug 2015)
Professor John Sterman and Climate Interactive featured in film “Disruption”
The film Disruption features incredible and informative interviews from scientists, activists and leaders—including Climate Interactive partner John Sterman of MIT. The film was released in advance of the People’s Climate March, the largest climate march in history, in the streets of New York City on September 21, 2014. (September 2014)
System Dynamics Application Award
The System Dynamics Applications Award is presented by the Society every other year for the best “real world” application of system dynamics. The Society awarded its 2013 Applications Award to John Sterman, Thomas Fiddaman, Travis Franck, Andrew Jones, Stephanie McCauley, Philip Rice, Elizabeth Sawin and Lori Siegel for their work Climate Interactive: The C-ROADS Climate Policy Model. To see the citation that was made by Brad Morisson at the conference, please follow this link. (Jul 2013)

Professor John Sterman wrote an article in Climate Progress
It’s a great short article by John Sterman articulating why it is crucial to “hold our feet to the fire” WRT +2C maximum global warming target (i.e., to promote carbon emissions mitigation), while being careful, skeptical and perhaps even averse to climate resilience initiatives (i.e., to avoid engaging in adaptation to climate change). This article is contemporary, and more relevant as each day passes by without a global commitment to limit climate damage to a level that adaptation becomes pertinent. Please follow this link to find the article. (Jul 2013)
OTHER SUCCESSFUL APPLICATIONS
Fast-Track Cities Uses System Dynamics to Enhance HIV Care
Fast-Track Cities Uses System Dynamics to Enhance HIV Care EXECUTIVE Summary Low levels of viral suppression at 69% for people with HIV make it hard to believe the 95% target level will be achieved by 2030 in St. Louis, USA. As a solution, Fast-Track Cities-STL opted...
System Dynamics Unravels ICU Tensions at the Portuguese Oncology Institute
System Dynamics Unravels ICU Tensions at the Portuguese Oncology Institute EXECUTIVE Summary The Portuguese Oncology Institute (IPO) faced a critical challenge in its intensive care unit (ICU) where doctors and nurses experienced high turnover due to tensions with...
System Dynamics Helps Farmers Escape Poverty Trap in Guatemala
System Dynamics Helps Farmers Escape Poverty Trap in Guatemala EXECUTIVE Summary Guatemala holds the 4th highest global ranking for chronic malnutrition, and climate change is intensifying the challenges subsistence farmers face in providing food for their families....
Upcoming Events
From Text to Map: A System Dynamics Bot for Constructing Causal Loop Diagrams
May, 15 at 11 am NY | 4 pm London | 11 pm Beijing | Time Converter From Text to Map: A System Dynamics Bot for Constructing Causal Loop Diagrams Join us to delve into the innovative System Dynamics Bot, a tool designed to automate causal loop diagram creation from...
Recent Posts
From Bergen to Global: UiB’s System Dynamics Group
From Bergen to Global: UiB’s System Dynamics Group The System Dynamics Group, an autonomous research group at the University of Bergen (UiB) was established in 1971 by professor emeritus Svein Nordbotten. Inspired by the work of Jay W. Forrester, Nordbotten...
Consideo’s Insight into the Global Energy Transition: A Systems Perspective
Consideo’s Insight into the Global Energy Transition: A Systems Perspective Complexities of Energy TransitionThe global energy transition is a complex challenge. The development of technology, the need for resources, the depletion of high-grade materials and...
A Digital Twin Business Model in 40 Hours
A Digital Twin Business Model in 40 Hours Though long past the date when I should have ‘retired’, I just can’t resist interesting projects, like the one a new friend brought me a few weeks ago. It concerns a small but fast-growing B2B business,...
Join us
OTHER SUCCESSFUL APPLICATIONS
Fast-Track Cities Uses System Dynamics to Enhance HIV Care
Fast-Track Cities Uses System Dynamics to Enhance HIV Care EXECUTIVE Summary Low levels of viral suppression at 69% for people with HIV make it hard to believe the 95% target level will be achieved by 2030 in St. Louis, USA. As a solution, Fast-Track Cities-STL opted...
System Dynamics Unravels ICU Tensions at the Portuguese Oncology Institute
System Dynamics Unravels ICU Tensions at the Portuguese Oncology Institute EXECUTIVE Summary The Portuguese Oncology Institute (IPO) faced a critical challenge in its intensive care unit (ICU) where doctors and nurses experienced high turnover due to tensions with...
System Dynamics Helps Farmers Escape Poverty Trap in Guatemala
System Dynamics Helps Farmers Escape Poverty Trap in Guatemala EXECUTIVE Summary Guatemala holds the 4th highest global ranking for chronic malnutrition, and climate change is intensifying the challenges subsistence farmers face in providing food for their families....
Recent Posts
From Bergen to Global: UiB’s System Dynamics Group
From Bergen to Global: UiB’s System Dynamics Group The System Dynamics Group, an autonomous research group at the University of Bergen (UiB) was established in 1971 by professor emeritus Svein Nordbotten. Inspired by the work of Jay W. Forrester, Nordbotten...
Consideo’s Insight into the Global Energy Transition: A Systems Perspective
Consideo’s Insight into the Global Energy Transition: A Systems Perspective Complexities of Energy TransitionThe global energy transition is a complex challenge. The development of technology, the need for resources, the depletion of high-grade materials and...
A Digital Twin Business Model in 40 Hours
A Digital Twin Business Model in 40 Hours Though long past the date when I should have ‘retired’, I just can’t resist interesting projects, like the one a new friend brought me a few weeks ago. It concerns a small but fast-growing B2B business,...
Upcoming Events
From Text to Map: A System Dynamics Bot for Constructing Causal Loop Diagrams
May, 15 at 11 am NY | 4 pm London | 11 pm Beijing | Time Converter From Text to Map: A System Dynamics Bot for Constructing Causal Loop Diagrams Join us to delve into the innovative System Dynamics Bot, a tool designed to automate causal loop diagram creation from...